


Personal finance website WalletHub has recently determined which U.S. states have contributed most to America’s innovative success and which have been lacking.
The site analyzed the states (and the District of Columbia) across 18 key metrics such as share of STEM professionals, scientific knowledge output, eighth grade math and science performance, R&D spending per capita, tax friendliness, and average internet speed.
Below are some of the highlights from the analysis followed by the ten most and least innovative states:
- The District of Columbia has the highest share of STEM professionals, 9.4 percent, 2.8 times higher than in Mississippi and Nevada, which have the lowest at 3.3 percent each.
- Virginia has the highest share of technology companies, 7.52 percent, 3.9 times higher than in West Virginia, which has the lowest at 1.95 percent.
- New Mexico has the highest research and development (R&D) intensity, 6.31 percent, 19.7 times higher than in Wyoming, which has the lowest at 0.32 percent.
- The District of Columbia has the fastest average Internet speed, 22.47 Mbps, 2.1 times faster than in Idaho, which has the slowest at 10.65 Mbps.
- The District of Columbia has the highest share of public high-school students who completed advanced-placement (AP) exams, 60.2 percent, 4.4 times higher than in North Dakota, which has the lowest at 13.8 percent.
Most Innovative States
1. District of Columbia
2. Maryland
3. Massachusetts
4. California
5. Colorado
6. Washington
7. Virginia
8. Utah
9. Connecticut
10. New Hampshire
Least Innovative States
42. Maine
43. South Dakota
44. Iowa
45. Tennessee
46. North Dakota
47. Oklahoma
48. Kentucky
49. Louisiana
50. Mississippi
51. West Virginia
For the full list and an in-depth look at the methodology, click here.
Related Stories

Market Data | May 20, 2020
Architecture billings continue historic contraction
AIA’s Architecture Billings Index (ABI) score of 29.5 for April reflects a decrease in design services provided by U.S. architecture firms.

Market Data | May 19, 2020
5 must reads for the AEC industry today: May 19, 2020
Clemson's new mass timber building and empty hotels as an answer for the affordable housing shortage.

Market Data | May 18, 2020
5 must reads for the AEC industry today: May 18, 2020
California's grid can support all-electric buildings and you'll miss your office when it's gone.

Market Data | May 15, 2020
6 must reads for the AEC industry today: May 15, 2020
Nonresidential construction employment sees record loss and Twitter will keep all of its office space.
Market Data | May 15, 2020
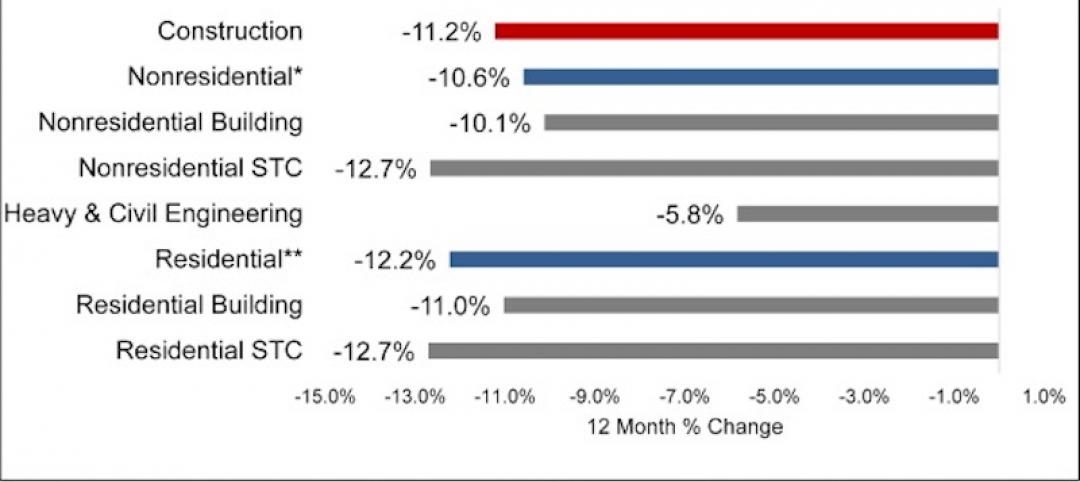
Nonresidential construction employment sees record loss in April
The construction unemployment rate was 16.6% in April, up 11.9 percentage points from the same time last year.
Market Data | May 14, 2020
5 must reads for the AEC industry today: May 14, 2020
The good news about rent might not be so good and some hotel developers consider whether to abandon projects.

Market Data | May 13, 2020
House democrats' coronavirus measure provides some relief for contractors, but lacks other steps needed to help construction
Construction official says new highway funding, employee retention credits and pension relief will help, but lack of safe harbor measure, Eextension of unemployment bonus will undermine recovery.

Market Data | May 13, 2020
5 must reads for the AEC industry today: May 13, 2020
How to design resilient libraries in a post-covid world and vacation real-estate markets are 'toast.'
Market Data | May 12, 2020
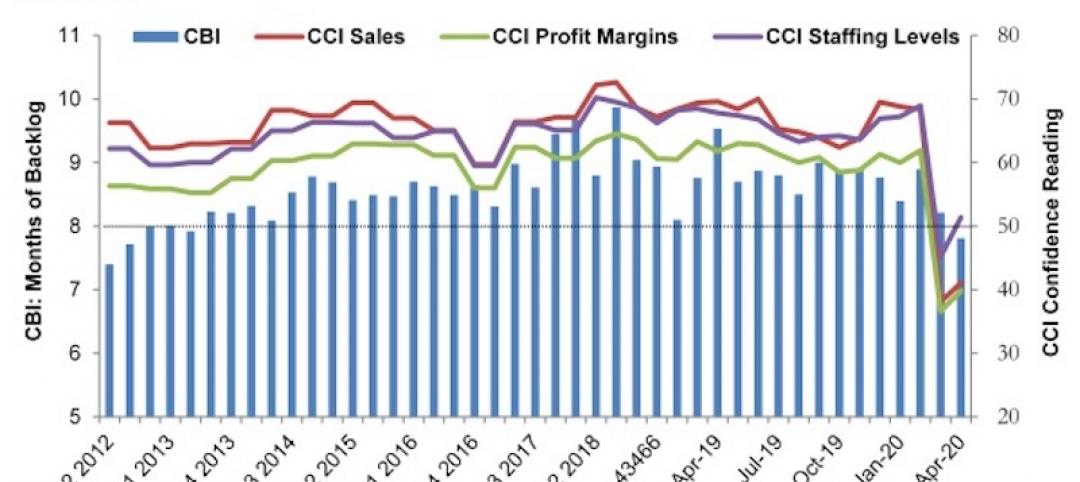
ABC’s Construction Backlog Indicator falls in April; Contractor Confidence rebounds from historic lows
Nonresidential construction backlog is down 0.4 months compared to the March 2020 ABC survey and 1.7 months from April 2019.

Market Data | May 12, 2020
6 must reads for the AEC industry today: May 12, 2020
A 13-point plan to reduce coronavirus deaths in nursing homes and Bjarke Ingels discusses building on Mars.


