


Personal finance website WalletHub has recently determined which U.S. states have contributed most to America’s innovative success and which have been lacking.
The site analyzed the states (and the District of Columbia) across 18 key metrics such as share of STEM professionals, scientific knowledge output, eighth grade math and science performance, R&D spending per capita, tax friendliness, and average internet speed.
Below are some of the highlights from the analysis followed by the ten most and least innovative states:
- The District of Columbia has the highest share of STEM professionals, 9.4 percent, 2.8 times higher than in Mississippi and Nevada, which have the lowest at 3.3 percent each.
- Virginia has the highest share of technology companies, 7.52 percent, 3.9 times higher than in West Virginia, which has the lowest at 1.95 percent.
- New Mexico has the highest research and development (R&D) intensity, 6.31 percent, 19.7 times higher than in Wyoming, which has the lowest at 0.32 percent.
- The District of Columbia has the fastest average Internet speed, 22.47 Mbps, 2.1 times faster than in Idaho, which has the slowest at 10.65 Mbps.
- The District of Columbia has the highest share of public high-school students who completed advanced-placement (AP) exams, 60.2 percent, 4.4 times higher than in North Dakota, which has the lowest at 13.8 percent.
Most Innovative States
1. District of Columbia
2. Maryland
3. Massachusetts
4. California
5. Colorado
6. Washington
7. Virginia
8. Utah
9. Connecticut
10. New Hampshire
Least Innovative States
42. Maine
43. South Dakota
44. Iowa
45. Tennessee
46. North Dakota
47. Oklahoma
48. Kentucky
49. Louisiana
50. Mississippi
51. West Virginia
For the full list and an in-depth look at the methodology, click here.
Related Stories

Market Data | Aug 6, 2020
6 must reads for the AEC industry today: August 6, 2020
Oklahoma State's new North Academic Building and can smart buildings outsmart coronavirus?

Market Data | Aug 5, 2020
6 must reads for the AEC industry today: August 5, 2020
San Jose's new tallest tower and Virginia is the first state to adopt COVID-19 worker safety rules.

Market Data | Aug 4, 2020
7 must reads for the AEC industry today: August 4, 2020
Construction spending decreases for fourth consecutive month and 100% affordable housing development breaks ground in Mountain View.
Market Data | Aug 3, 2020
Construction spending decreases for fourth consecutive month in June
Association officials warn further contraction is likely unless federal government enacts prompt, major investment in infrastructure as state and local governments face deficits.

Market Data | Aug 3, 2020
6 must reads for the AEC industry today: August 3, 2020
The future is a number game for retail and restaurants and 5 reasons universities are renovating student housing.

Market Data | Jul 31, 2020
5 must reads for the AEC industry today: July 31, 2020
Vegas's newest resort and casino is packed with contactless technology and Mariott, Hilton, and IHG dominate the U.S. hotel construction pipeline.

Market Data | Jul 30, 2020
Marriott, Hilton, and IHG continue to dominate the U.S. hotel construction pipeline at Q2’20 close
Hilton’s Home2 Suites and IHG’s Holiday Inn Express continue to be the most prominent brands in the U.S. pipeline.

Market Data | Jul 30, 2020
7 must reads for the AEC industry today: July 30, 2020
Millennium Tower finally has a fix and construction costs decrease for the first time in 10 years.
Market Data | Jul 29, 2020
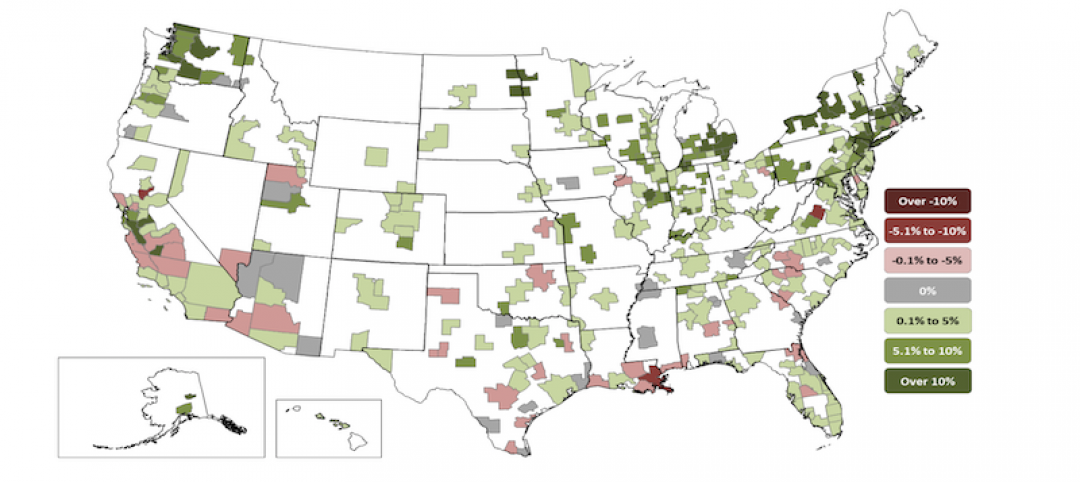
62% of metros shed construction jobs from June 2019 to June 2020 as Association calls for new infrastructure funding, other relief steps
New York City and Brockton-Bridgewater-Easton, Mass. have worst 12-month losses, while Austin and Walla Walla, Wash. top job gainers.

Market Data | Jul 29, 2020
6 must reads for the AEC industry today: July 29, 2020
The world's first net-zero airport and California utility adopts climate emergency declaration.


