


Personal finance website WalletHub has recently determined which U.S. states have contributed most to America’s innovative success and which have been lacking.
The site analyzed the states (and the District of Columbia) across 18 key metrics such as share of STEM professionals, scientific knowledge output, eighth grade math and science performance, R&D spending per capita, tax friendliness, and average internet speed.
Below are some of the highlights from the analysis followed by the ten most and least innovative states:
- The District of Columbia has the highest share of STEM professionals, 9.4 percent, 2.8 times higher than in Mississippi and Nevada, which have the lowest at 3.3 percent each.
- Virginia has the highest share of technology companies, 7.52 percent, 3.9 times higher than in West Virginia, which has the lowest at 1.95 percent.
- New Mexico has the highest research and development (R&D) intensity, 6.31 percent, 19.7 times higher than in Wyoming, which has the lowest at 0.32 percent.
- The District of Columbia has the fastest average Internet speed, 22.47 Mbps, 2.1 times faster than in Idaho, which has the slowest at 10.65 Mbps.
- The District of Columbia has the highest share of public high-school students who completed advanced-placement (AP) exams, 60.2 percent, 4.4 times higher than in North Dakota, which has the lowest at 13.8 percent.
Most Innovative States
1. District of Columbia
2. Maryland
3. Massachusetts
4. California
5. Colorado
6. Washington
7. Virginia
8. Utah
9. Connecticut
10. New Hampshire
Least Innovative States
42. Maine
43. South Dakota
44. Iowa
45. Tennessee
46. North Dakota
47. Oklahoma
48. Kentucky
49. Louisiana
50. Mississippi
51. West Virginia
For the full list and an in-depth look at the methodology, click here.
Related Stories

Market Data | May 18, 2022
Architecture Billings Index moderates slightly, remains strong
For the fifteenth consecutive month architecture firms reported increasing demand for design services in April, according to a new report today from The American Institute of Architects (AIA).

Market Data | May 12, 2022
Monthly construction input prices increase in April
Construction input prices increased 0.8% in April compared to the previous month, according to an Associated Builders and Contractors analysis of U.S. Bureau of Labor Statistics’ Producer Price Index data released today.

Market Data | May 10, 2022
Hybrid work could result in 20% less demand for office space
Global office demand could drop by between 10% and 20% as companies continue to develop policies around hybrid work arrangements, a Barclays analyst recently stated on CNBC.

Market Data | May 6, 2022
Nonresidential construction spending down 1% in March
National nonresidential construction spending was down 0.8% in March, according to an Associated Builders and Contractors analysis of data published today by the U.S. Census Bureau.
Market Data | Apr 29, 2022
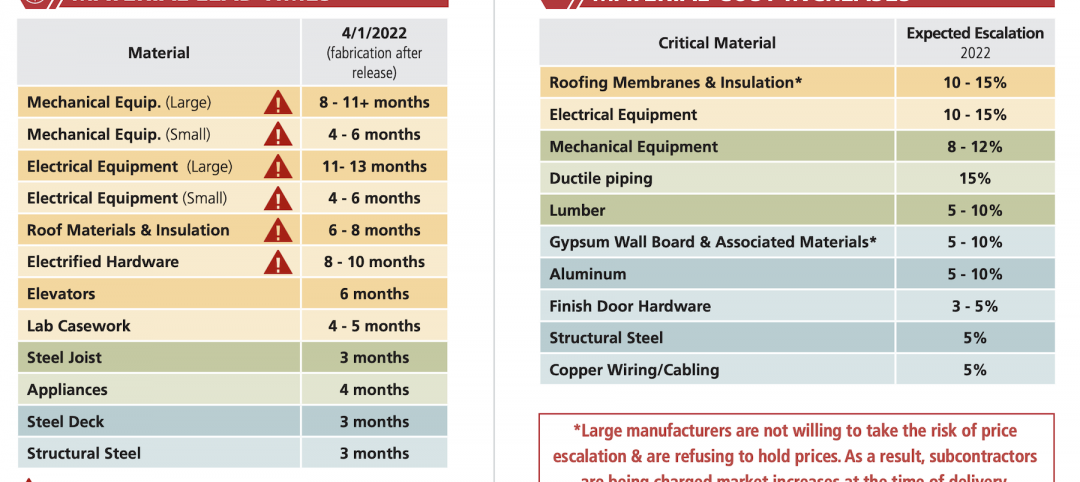
Global forces push construction prices higher
Consigli’s latest forecast predicts high single-digit increases for this year.

Market Data | Apr 29, 2022
U.S. economy contracts, investment in structures down, says ABC
The U.S. economy contracted at a 1.4% annualized rate during the first quarter of 2022.

Market Data | Apr 20, 2022
Pace of demand for design services rapidly accelerates
Demand for design services in March expanded sharply from February according to a new report today from The American Institute of Architects (AIA).

Market Data | Apr 14, 2022
FMI 2022 construction spending forecast: 7% growth despite economic turmoil
Growth will be offset by inflation, supply chain snarls, a shortage of workers, project delays, and economic turmoil caused by international events such as the Russia-Ukraine war.
Industrial Facilities | Apr 14, 2022
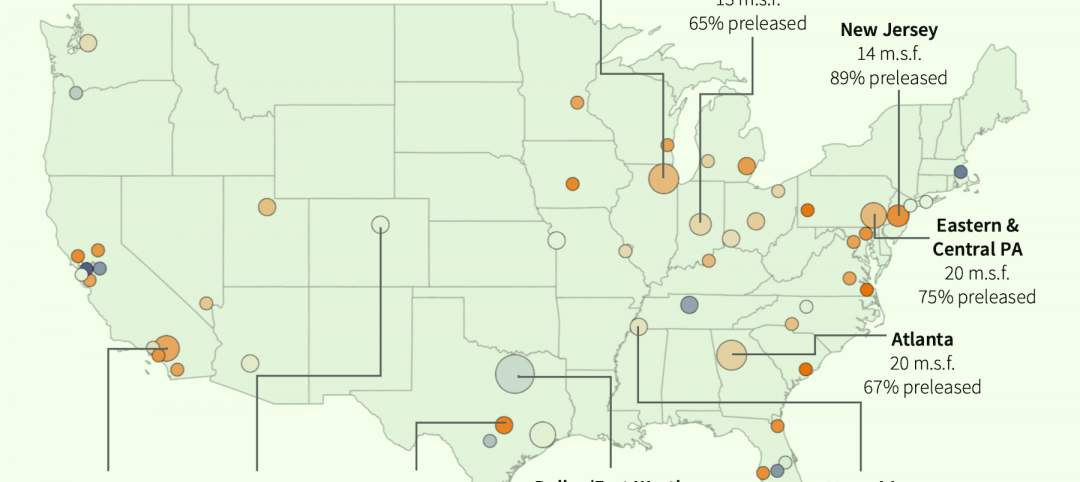
JLL's take on the race for industrial space
In the previous decade, the inventory of industrial space couldn’t keep up with demand that was driven by the dual surges of the coronavirus and online shopping. Vacancies declined and rents rose. JLL has just published a research report on this sector called “The Race for Industrial Space.” Mehtab Randhawa, JLL’s Americas Head of Industrial Research, shares the highlights of a new report on the industrial sector's growth.

Codes and Standards | Apr 4, 2022
Construction of industrial space continues robust growth
Construction and development of new industrial space in the U.S. remains robust, with all signs pointing to another big year in this market segment


