

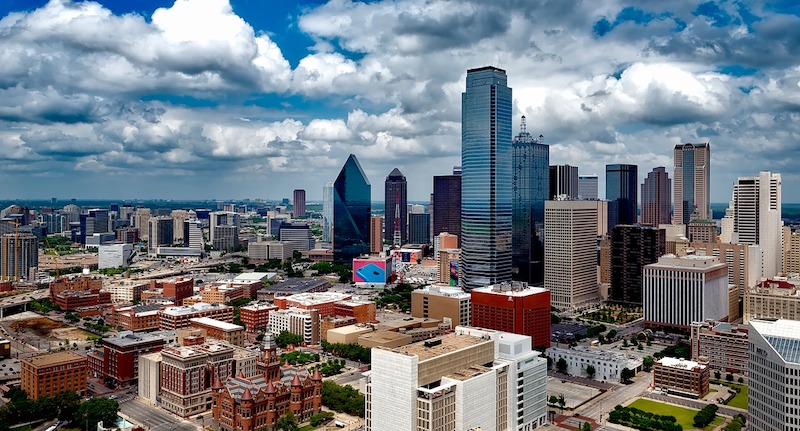
According to a new study from COMMERCIALCafé, Dallas leads the way as the city in the United States with the highest potential for urban infill development. The results are based on the total developable vacant land available in each city’s central business district.
Dallas has a total of 86.37 acres of developable land in its central business district, 11 more than the second place city of Las Vegas, which has 75.16 acres. Austin (70.72), San Antonio (42.39), and Phoenix (31.03) round out the top five.
An additional COMMERCIALCafé survey asked individuals living in the top 25 cities what they want to see built in their city’s urban core and what they felt the city needs most. Affordable housing was the most common answer for what a given respondent’s city needs at 82%. Housing and parks were the most desired improvements at 77%. Additionally, walkability was the top infrastructure improvement highlighted in all 25 cities.
Click here for the full study.

Related Stories

Market Data | Mar 14, 2019
Construction input prices rise for first time since October
Of the 11 construction subcategories, seven experienced price declines for the month.

Market Data | Mar 6, 2019
Global hotel construction pipeline hits record high at 2018 year-end
There are a record-high 6,352 hotel projects and 1.17 million rooms currently under construction worldwide.

Market Data | Feb 28, 2019
U.S. economic growth softens in final quarter of 2018
Year-over-year GDP growth was 3.1%, while average growth for 2018 was 2.9%.

Market Data | Feb 20, 2019
Strong start to 2019 for architecture billings
“The government shutdown affected architecture firms, but doesn’t appear to have created a slowdown in the profession,” said AIA Chief Economist Kermit Baker, Hon. AIA, PhD, in the latest ABI report.

Market Data | Feb 19, 2019
ABC Construction Backlog Indicator steady in Q4 2018
CBI reached a record high of 9.9 months in the second quarter of 2018 and averaged about 9.1 months throughout all four quarters of last year.

Market Data | Feb 14, 2019
U.S. Green Building Council announces top 10 countries and regions for LEED green building
The list ranks countries and regions in terms of cumulative LEED-certified gross square meters as of December 31, 2018.

Market Data | Feb 13, 2019
Increasingly tech-enabled construction industry powers forward despite volatility
Construction industry momentum to carry through first half of 2019.

Market Data | Feb 4, 2019
U.S. Green Building Council announces annual Top 10 States for LEED Green Building in 2018
Illinois takes the top spot as USGBC defines the next generation of green building with LEED v4.1.

Market Data | Feb 4, 2019
Nonresidential construction spending dips in November
Total nonresidential spending stood at $751.5 billion on a seasonally adjusted annualized rate.

Market Data | Feb 1, 2019
The year-end U.S. hotel construction pipeline continues steady growth trend
Project counts in the early planning stage continue to rise reaching an all-time high of 1,723 projects/199,326 rooms.


