

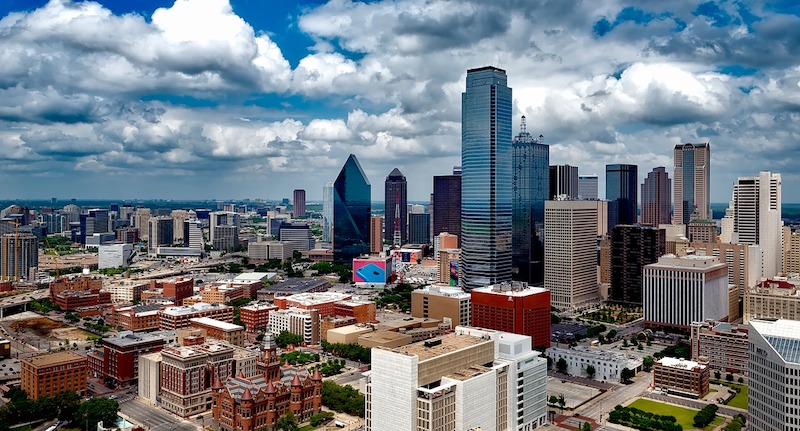
According to a new study from COMMERCIALCafé, Dallas leads the way as the city in the United States with the highest potential for urban infill development. The results are based on the total developable vacant land available in each city’s central business district.
Dallas has a total of 86.37 acres of developable land in its central business district, 11 more than the second place city of Las Vegas, which has 75.16 acres. Austin (70.72), San Antonio (42.39), and Phoenix (31.03) round out the top five.
An additional COMMERCIALCafé survey asked individuals living in the top 25 cities what they want to see built in their city’s urban core and what they felt the city needs most. Affordable housing was the most common answer for what a given respondent’s city needs at 82%. Housing and parks were the most desired improvements at 77%. Additionally, walkability was the top infrastructure improvement highlighted in all 25 cities.
Click here for the full study.

Related Stories

Market Data | Sep 18, 2020
6 must reads for the AEC industry today: September 18, 2020
Sagrada Familia completion date pushed back and energy code appeals could hamper efficiency progress.

Market Data | Sep 17, 2020
6 must reads for the AEC industry today: September 17, 2020
Foster + Partners-designed hospital begins construction in Cairo and heat pumps are the future for hot water.

Market Data | Sep 16, 2020
6 must reads for the AEC industry today: September 16, 2020
REI sells unused HQ building and Adjaye Associates will design The Africa Institute.

Market Data | Sep 15, 2020
7 must reads for the AEC industry today: September 15, 2020
Energy efficiency considerations for operating buildings during a pandemic and is there really a glass box paradox?

Market Data | Sep 14, 2020
6 must reads for the AEC industry today: September 14, 2020
63% of New York's restaurants could be gone by 2021 and new weapons in the apartment amenities arms race.

Market Data | Sep 11, 2020
5 must reads for the AEC industry today: September 11, 2020
Des Moines University begins construction on new campus and the role of urgent care in easing the oncology journey.

Market Data | Sep 10, 2020
6 must reads for the AEC industry today: September 10, 2020
Taipei's new Performance Hall and Burger King's touchless restaurant designs.

Market Data | Sep 9, 2020
6 must reads for the AEC industry today: September 9, 2020
What will the 'new normal' look like and the AIA hands out its Twenty-five Year Award.

Market Data | Sep 8, 2020
‘New normal’: IAQ, touchless, and higher energy bills?
Not since 9/11 has a single event so severely rocked the foundation of the commercial building industry.

Market Data | Sep 8, 2020
7 must reads for the AEC industry today: September 8, 2020
Google proposes 40-acre redevelopment plan and office buildings should be an essential part of their communities.


