


Clean, well-maintained restrooms play a bigger role in a student’s perception of a school as a whole than one may think.
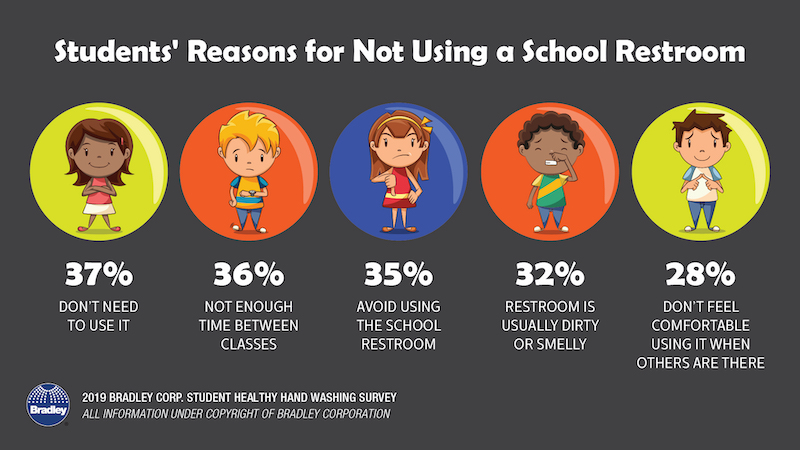
According to Bradley Corporation’s new Healthy Hand Washing Survey of 9th to 12th graders, 68% of students say school restrooms that are poorly maintained or unclean show the school doesn’t care about its students, reflects poor school management, and lowers their overall opinion of the school. 19% of the students surveyed say they never frequent school bathrooms, in part because they are dirty, smelly, or have broken or old toilets, sinks, and doors.
Students’ top request for how to improve the restrooms is more privacy; they want taller stall doors and to eliminate gaps between stall panels. Their second request is for cleaner facilities, with more air fresheners as the third request. Foul odors tops the list of what bothers them most about school restrooms. When confronted with a dirty bathroom, over half of the students say they leave without using it, and 39% say they try to avoid using that bathroom in the future.
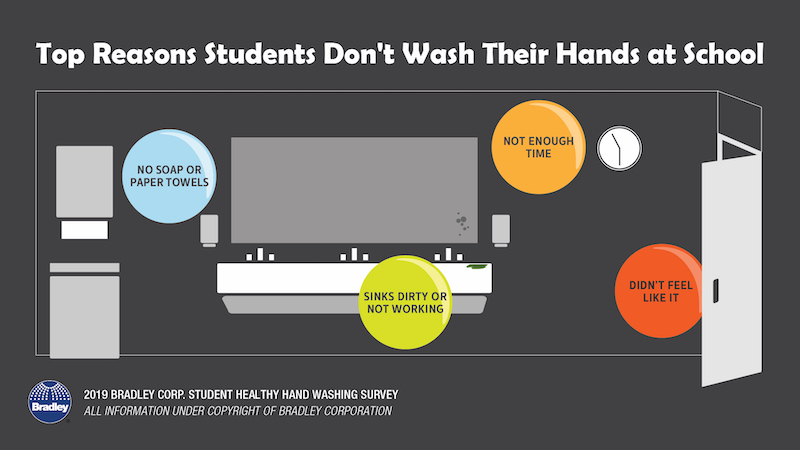
The top reasons students skipped washing their hands after using the bathroom are: no soap or paper towels, the sinks are dirty or don’t work, not enough time, and they just didn’t feel like it. While most school’s don’t post hand washing reminders in their bathrooms (only 34% of schools say they do), 57% of students say they’d be more likely to wash if there was a sign.
Related Stories

Industry Research | Nov 8, 2016
Austin, Texas wins ‘Top City’ in the Emerging Trends in Real Estate outlook
Austin was followed on the list by Dallas/Fort Worth, Texas and Portland, Ore.

Market Data | Nov 2, 2016
Nonresidential construction spending down in September, but August data upwardly revised
The government revised the August nonresidential construction spending estimate from $686.6 billion to $696.6 billion.

Market Data | Oct 31, 2016
Nonresidential fixed investment expands again during solid third quarter
The acceleration in real GDP growth was driven by a combination of factors, including an upturn in exports, a smaller decrease in state and local government spending and an upturn in federal government spending, says ABC Chief Economist Anirban Basu.

Market Data | Oct 28, 2016
U.S. construction solid and stable in Q3 of 2016; Presidential election seen as influence on industry for 2017
Rider Levett Bucknall’s Third Quarter 2016 USA Construction Cost Report puts the complete spectrum of construction sectors and markets in perspective as it assesses the current state of the industry.

Industry Research | Oct 25, 2016
New HOK/CoreNet Global report explores impact of coworking on corporate real rstate
“Although coworking space makes up less than one percent of the world’s office space, it represents an important workforce trend and highlights the strong desire of today’s employees to have workplace choices, community and flexibility,” says Kay Sargent, Director of WorkPlace at HOK.

Market Data | Oct 24, 2016
New construction starts in 2017 to increase 5% to $713 billion
Dodge Outlook Report predicts moderate growth for most project types – single family housing, commercial and institutional building, and public works, while multifamily housing levels off and electric utilities/gas plants decline.

High-rise Construction | Oct 21, 2016
The world’s 100 tallest buildings: Which architects have designed the most?
Two firms stand well above the others when it comes to the number of tall buildings they have designed.

Market Data | Oct 19, 2016
Architecture Billings Index slips consecutive months for first time since 2012
“This recent backslide should act as a warning signal,” said AIA Chief Economist, Kermit Baker.

Market Data | Oct 11, 2016
Building design revenue topped $28 billion in 2015
Growing profitability at architecture firms has led to reinvestment and expansion
Market Data | Oct 4, 2016
Nonresidential spending slips in August
Public sector spending is declining faster than the private sector.


