


Clean, well-maintained restrooms play a bigger role in a student’s perception of a school as a whole than one may think.
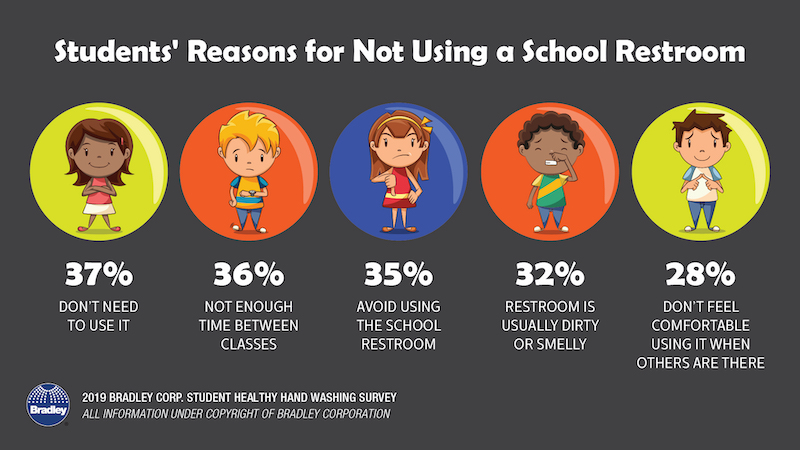
According to Bradley Corporation’s new Healthy Hand Washing Survey of 9th to 12th graders, 68% of students say school restrooms that are poorly maintained or unclean show the school doesn’t care about its students, reflects poor school management, and lowers their overall opinion of the school. 19% of the students surveyed say they never frequent school bathrooms, in part because they are dirty, smelly, or have broken or old toilets, sinks, and doors.
Students’ top request for how to improve the restrooms is more privacy; they want taller stall doors and to eliminate gaps between stall panels. Their second request is for cleaner facilities, with more air fresheners as the third request. Foul odors tops the list of what bothers them most about school restrooms. When confronted with a dirty bathroom, over half of the students say they leave without using it, and 39% say they try to avoid using that bathroom in the future.
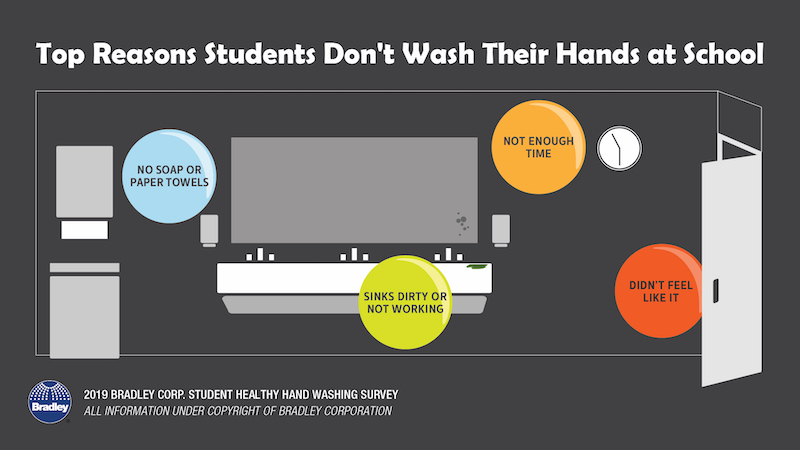
The top reasons students skipped washing their hands after using the bathroom are: no soap or paper towels, the sinks are dirty or don’t work, not enough time, and they just didn’t feel like it. While most school’s don’t post hand washing reminders in their bathrooms (only 34% of schools say they do), 57% of students say they’d be more likely to wash if there was a sign.
Related Stories

Market Data | Mar 22, 2018
Architecture billings continue to hold positive in 2018
Billings particularly strong at firms in the West and Midwest regions.

Market Data | Mar 21, 2018
Construction employment increases in 248 metro areas as new metal tariffs threaten future sector job gains
Riverside-San Bernardino-Ontario, Calif., and Merced, Calif., experience largest year-over-year gains; Baton Rouge, La., and Auburn-Opelika, Ala., have biggest annual declines in construction employment.

Market Data | Mar 19, 2018
ABC's Construction Backlog Indicator hits a new high: 2018 poised to be a very strong year for construction spending
CBI is up by 1.36 months, or 16.3%, on a year-over-year basis.

Market Data | Mar 15, 2018
ABC: Construction materials prices continue to expand briskly in February
Compared to February 2017, prices are up 5.2%.

Market Data | Mar 14, 2018
AGC: Tariff increases threaten to make many project unaffordable
Construction costs escalated in February, driven by price increases for a wide range of building materials, including steel and aluminum.

Market Data | Mar 12, 2018
Construction employers add 61,000 jobs in February and 254,000 over the year
Hourly earnings rise 3.3% as sector strives to draw in new workers.

Steel Buildings | Mar 9, 2018
New steel and aluminum tariffs will hurt construction firms by raising materials costs; potential trade war will dampen demand, says AGC of America
Independent studies suggest the construction industry could lose nearly 30,000 jobs as a result of administration's new tariffs as many firms will be forced to absorb increased costs.

Market Data | Mar 8, 2018
Prioritizing your marketing initiatives
It’s time to take a comprehensive look at your plans and figure out the best way to get from Point A to Point B.

Market Data | Mar 6, 2018
Persistent workforce shortages challenge commercial construction industry as U.S. building demands continue to grow
To increase jobsite efficiency and improve labor productivity, increasingly more builders are turning to alternative construction solutions.

Market Data | Mar 2, 2018
Nonresidential construction spending dips slightly in January
Private nonresidential construction fell 1.5% for the month, while public sector nonresidential spending increased 1.9%.


