


Clean, well-maintained restrooms play a bigger role in a student’s perception of a school as a whole than one may think.
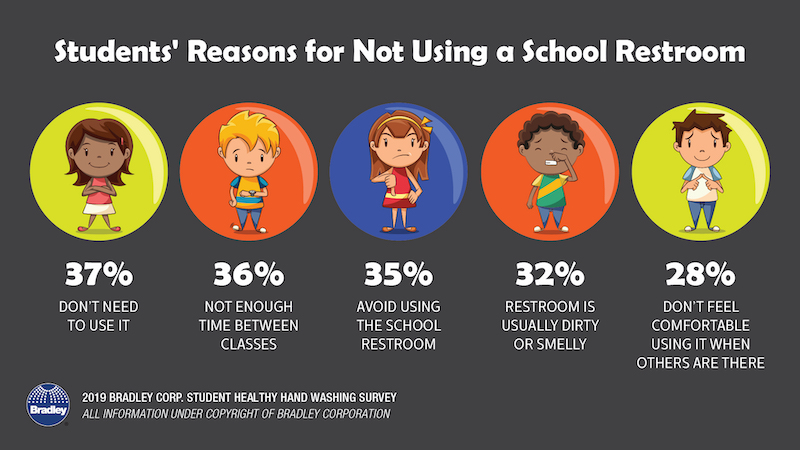
According to Bradley Corporation’s new Healthy Hand Washing Survey of 9th to 12th graders, 68% of students say school restrooms that are poorly maintained or unclean show the school doesn’t care about its students, reflects poor school management, and lowers their overall opinion of the school. 19% of the students surveyed say they never frequent school bathrooms, in part because they are dirty, smelly, or have broken or old toilets, sinks, and doors.
Students’ top request for how to improve the restrooms is more privacy; they want taller stall doors and to eliminate gaps between stall panels. Their second request is for cleaner facilities, with more air fresheners as the third request. Foul odors tops the list of what bothers them most about school restrooms. When confronted with a dirty bathroom, over half of the students say they leave without using it, and 39% say they try to avoid using that bathroom in the future.
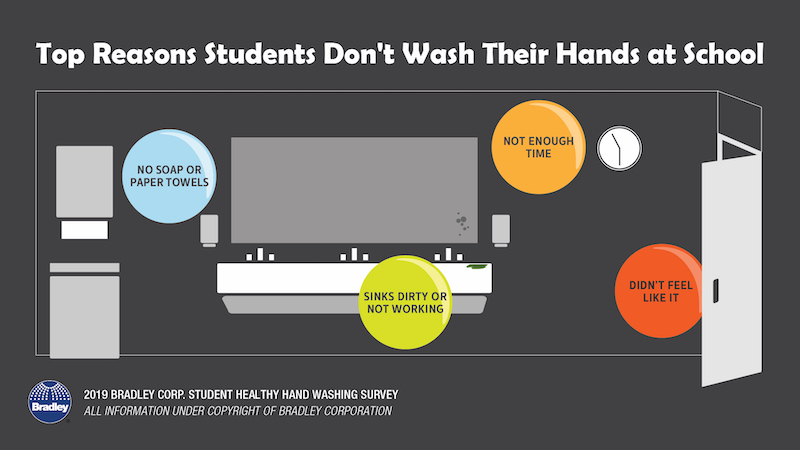
The top reasons students skipped washing their hands after using the bathroom are: no soap or paper towels, the sinks are dirty or don’t work, not enough time, and they just didn’t feel like it. While most school’s don’t post hand washing reminders in their bathrooms (only 34% of schools say they do), 57% of students say they’d be more likely to wash if there was a sign.
Related Stories

Market Data | Dec 4, 2019
Nonresidential construction spending falls in October
Private nonresidential spending fell 1.2% on a monthly basis and is down 4.3% from October 2018.

Market Data | Nov 25, 2019
Office construction lifts U.S. asking rental rate, but slowing absorption in Q3 raises concerns
12-month net absorption decelerates by one-third from 2018 total.

Market Data | Nov 22, 2019
Architecture Billings Index rebounds after two down months
The Architecture Billings Index (ABI) score in October is 52.0.

Market Data | Nov 14, 2019
Construction input prices unchanged in October
Nonresidential construction input prices fell 0.1% for the month and are down 2.0% compared to the same time last year.

Multifamily Housing | Nov 7, 2019
Multifamily construction market remains strong heading into 2020
Fewer than one in 10 AEC firms doing multifamily work reported a decrease in proposal activity in Q3 2019, according to a PSMJ report.

Market Data | Nov 5, 2019
Construction and real estate industry deals in September 2019 total $21.7bn globally
In terms of number of deals, the sector saw a drop of 4.4% over the last 12-month average.

Market Data | Nov 4, 2019
Nonresidential construction spending rebounds slightly in September
Private nonresidential spending fell 0.3% on a monthly basis and is down 5.7% compared to the same time last year.

Market Data | Nov 1, 2019
GDP growth expands despite reduction in nonresident investment
The annual rate for nonresidential fixed investment in structures declined 15.3% in the third quarter.

Market Data | Oct 24, 2019
Architecture Billings Index downturn moderates as challenging conditions continue
The Architecture Billings Index (ABI) score in September is 49.7.

Market Data | Oct 23, 2019
ABC’s Construction Backlog Indicator rebounds in August
The primary issue for most contractors is not a lack of demand, but an ongoing and worsening shortage of skilled workers available to meet contractual requirements.


