


Clean, well-maintained restrooms play a bigger role in a student’s perception of a school as a whole than one may think.
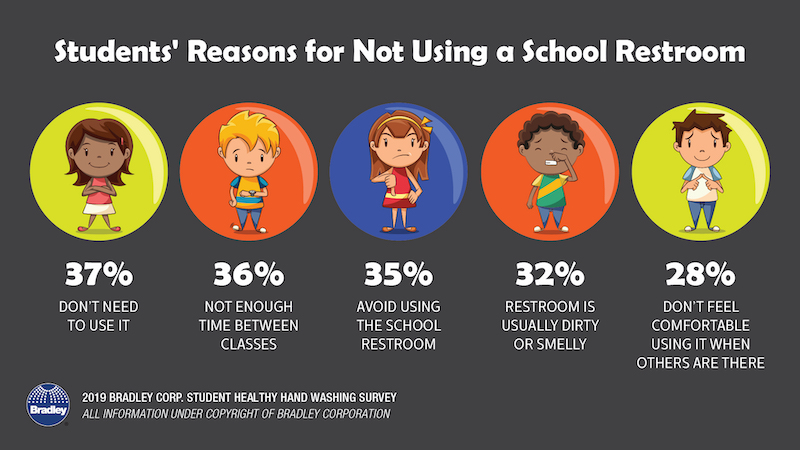
According to Bradley Corporation’s new Healthy Hand Washing Survey of 9th to 12th graders, 68% of students say school restrooms that are poorly maintained or unclean show the school doesn’t care about its students, reflects poor school management, and lowers their overall opinion of the school. 19% of the students surveyed say they never frequent school bathrooms, in part because they are dirty, smelly, or have broken or old toilets, sinks, and doors.
Students’ top request for how to improve the restrooms is more privacy; they want taller stall doors and to eliminate gaps between stall panels. Their second request is for cleaner facilities, with more air fresheners as the third request. Foul odors tops the list of what bothers them most about school restrooms. When confronted with a dirty bathroom, over half of the students say they leave without using it, and 39% say they try to avoid using that bathroom in the future.
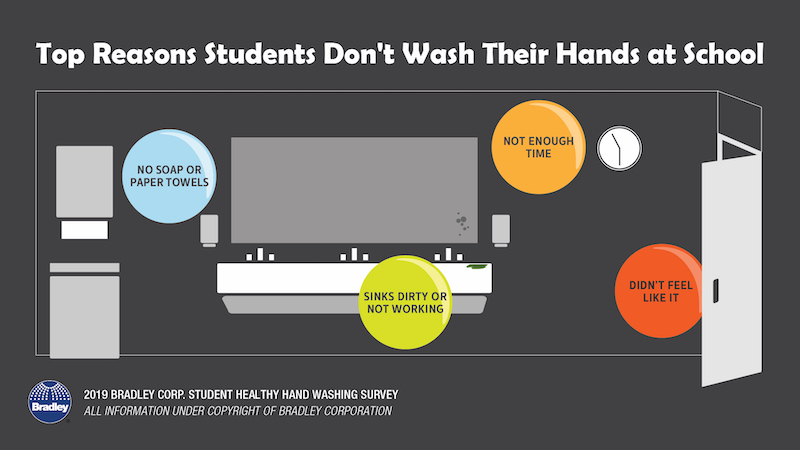
The top reasons students skipped washing their hands after using the bathroom are: no soap or paper towels, the sinks are dirty or don’t work, not enough time, and they just didn’t feel like it. While most school’s don’t post hand washing reminders in their bathrooms (only 34% of schools say they do), 57% of students say they’d be more likely to wash if there was a sign.
Related Stories

Market Data | Apr 28, 2021
Construction employment declines in 203 metro areas from March 2020 to March 2021
The decline occurs despite homebuilding boom and improving economy.

Market Data | Apr 20, 2021
The pandemic moves subs and vendors closer to technology
Consigli’s latest market outlook identifies building products that are high risk for future price increases.

Market Data | Apr 20, 2021
Demand for design services continues to rapidly escalate
AIA’s ABI score for March rose to 55.6 compared to 53.3 in February.

Market Data | Apr 16, 2021
Construction employment in March trails March 2020 mark in 35 states
Nonresidential projects lag despite hot homebuilding market.

Market Data | Apr 13, 2021
ABC’s Construction Backlog slips in March; Contractor optimism continues to improve
The Construction Backlog Indicator fell to 7.8 months in March.

Market Data | Apr 9, 2021
Record jump in materials prices and supply chain distributions threaten construction firms' ability to complete vital nonresidential projects
A government index that measures the selling price for goods used construction jumped 3.5% from February to March.

Contractors | Apr 9, 2021
Construction bidding activity ticks up in February
The Blue Book Network's Velocity Index measures month-to-month changes in bidding activity among construction firms across five building sectors and in all 50 states.

Industry Research | Apr 9, 2021
BD+C exclusive research: What building owners want from AEC firms
BD+C’s first-ever owners’ survey finds them focused on improving buildings’ performance for higher investment returns.

Market Data | Apr 7, 2021
Construction employment drops in 236 metro areas between February 2020 and February 2021
Houston-The Woodlands-Sugar Land and Odessa, Texas have worst 12-month employment losses.

Market Data | Apr 2, 2021
Nonresidential construction spending down 1.3% in February, says ABC
On a monthly basis, spending was down in 13 of 16 nonresidential subcategories.


