


Following a sizable decrease in demand for design services in March, the April Architecture Billings Index (ABI) climbed back into positive territory according to a new report today from The American Institute of Architects (AIA).
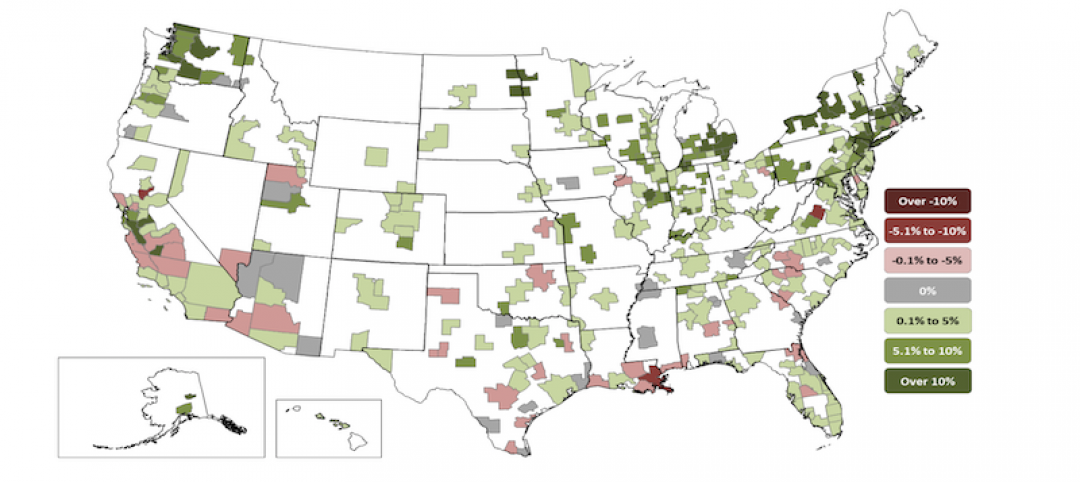
AIA’s ABI score for April showed a small increase in design services at 50.5 in April, which is up from 47.8 in March. Any score above 50 indicates an increase in billings. Additionally, business conditions remained strong at firms located in the South. Despite this and the positive overall billings score, most regional and sector indictors continue to display decreasing demand for design services.
“In contrast to 2018, conditions throughout the construction sector recently have become more unsettled,” said AIA Chief Economist Kermit Baker, PhD, Hon. AIA. “Though we may not be at a critical inflection point, the next several months of billing data will be indicative of the health of the industry going into 2020.”
Key ABI highlights for April include:
— Regional averages: South (51.6); Midwest (49.3); West (49.0); Northeast (45.1)
— Sector index breakdown: mixed practice (53.2); institutional (49.2); multi-family residential (47.4); commercial/industrial (46.6)
— Project inquiries index: 60.9
— Design contracts index: 52.1
The regional and sector categories are calculated as a three-month moving average, whereas the national index, design contracts and inquiries are monthly numbers.
Related Stories

Market Data | Aug 4, 2020
7 must reads for the AEC industry today: August 4, 2020
Construction spending decreases for fourth consecutive month and 100% affordable housing development breaks ground in Mountain View.
Market Data | Aug 3, 2020
Construction spending decreases for fourth consecutive month in June
Association officials warn further contraction is likely unless federal government enacts prompt, major investment in infrastructure as state and local governments face deficits.

Market Data | Aug 3, 2020
6 must reads for the AEC industry today: August 3, 2020
The future is a number game for retail and restaurants and 5 reasons universities are renovating student housing.

Market Data | Jul 31, 2020
5 must reads for the AEC industry today: July 31, 2020
Vegas's newest resort and casino is packed with contactless technology and Mariott, Hilton, and IHG dominate the U.S. hotel construction pipeline.

Market Data | Jul 30, 2020
Marriott, Hilton, and IHG continue to dominate the U.S. hotel construction pipeline at Q2’20 close
Hilton’s Home2 Suites and IHG’s Holiday Inn Express continue to be the most prominent brands in the U.S. pipeline.

Market Data | Jul 30, 2020
7 must reads for the AEC industry today: July 30, 2020
Millennium Tower finally has a fix and construction costs decrease for the first time in 10 years.
Market Data | Jul 29, 2020
62% of metros shed construction jobs from June 2019 to June 2020 as Association calls for new infrastructure funding, other relief steps
New York City and Brockton-Bridgewater-Easton, Mass. have worst 12-month losses, while Austin and Walla Walla, Wash. top job gainers.

Market Data | Jul 29, 2020
6 must reads for the AEC industry today: July 29, 2020
The world's first net-zero airport and California utility adopts climate emergency declaration.

Market Data | Jul 28, 2020
For the fourth consecutive quarter, Los Angeles leads the U.S. hotel construction pipeline at the close of Q2’ 20
New York City continues to have the greatest number of projects under construction, with 106 projects/18,354 rooms.

Market Data | Jul 28, 2020
6 must reads for the AEC industry today: July 28, 2020
St. Petersburg Pier reconstruction completes and post-pandemic workplace design will not be the same for all.


