

Nationally, the average cost to build out an office is $196.49/sf. But after taking into account the average landlord-provided tenant-improvement allowance of $43.61/sf, the out-of-pocket cost for tenants is $152.88/sf, according to JLL’s new U.S. Fit Out Guide.
The report combines fitout costs and tenant improvement allowances to paint a comprehensive picture of what companies can expect to pay out of pocket for an office buildout across the nation. It also details the most- and least-expensive markets for fitouts.
Coming out on top as the most expensive market to build out an office is Silicon Valley, Calif., with an out-of-pocket cost of $199.22. The most affordable market: Washington, D.C., at $103.88.
“It’s no surprise that the Northwest continues to be the most expensive region for office builds,” says Mason Mularoni, Senior Research Analyst, JLL Project and Development Services. Southern cities claimed six out of the 10 most affordable markets.
Due to the range of landlord-provided tenant improvement packages, some cities that made the top lists were pretty unexpected.
 Silicon Valley, Calif., is the most expensive market for office fitout projects, with an average out-of-pocket cost of $199.22/sf, according to JLL.
Washington, D.C.: most affordable. Often topping most-expensive lists, the District of Columbia is officially the most inexpensive market to build out an office space. As the federal government, contractors, and law firms continue to consolidate, slightly below-average buildout costs are offset by record-high concession packages from landlords who are desperate to get tenants into the exploding mass of available space.
Detroit: eighth most expensive. Once on the brink of financial collapse, the Motor City is being reinvigorated by an eager tech community. Startups, investors, and outside firms are attracted to the Motor City’s resolve to bounce back.
But Detroit isn’t in the clear just yet. Due to above-average buildout costs and minimal TI packages, the city swings in as one of the top out-of-pocket cost markets.
Los Angeles: sixth most affordable market to build out an office. New leasing activity has been nourished by the convergence of media, technology, and entertainment. The tech sector in particular has shown a preference for creative buildouts. LA’s enormous TI packages are tied with Washington, D.C., for largest in the nation, offering an affordable option in the notoriously expensive state.
Long Island, N.Y.: third most expensive, beating out traditional frontrunner New York City. When it comes to building costs alone, New York City tops the list. But substantial TI packages in the city allow Long Island to slide ahead in out-of-pocket costs, holding its own against the expensive Northern California cities.
Seattle: seventh most affordable. Although the Northwest region tops the most expensive list, Seattle is the exception to the rule. Technology continues to be the primary factor of the city, and significant growth is occurring from local companies as well as from tenants migrating from the Bay Area.
The second-largest TI package average across the nation enables Seattle to hold down seventh place in most-affordable-city honors.
Related Stories
Industry Research | Feb 8, 2024
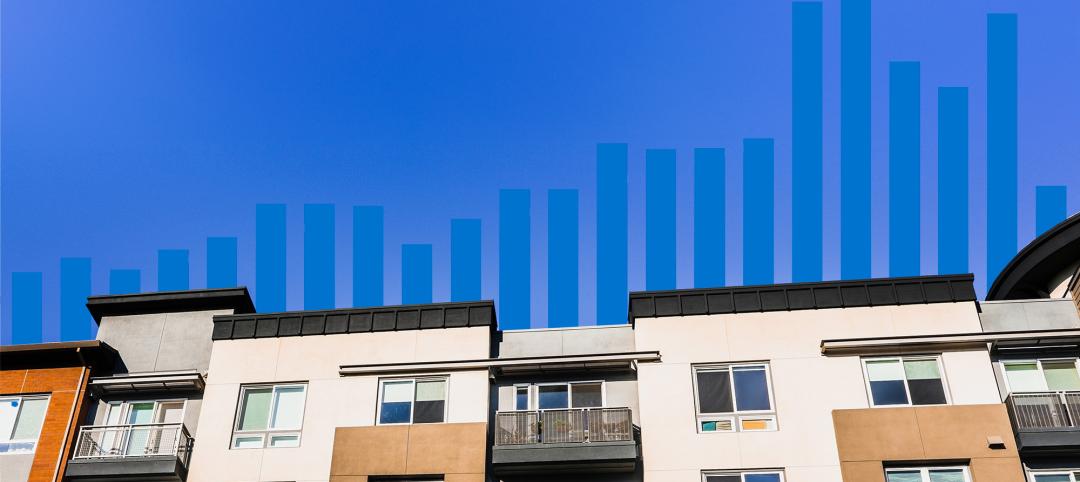
New multifamily development in 2023 exceeded expectations
Despite a problematic financing environment, 2023 multifamily construction starts held up “remarkably well” according to the latest Yardi Matrix report.

Market Data | Feb 7, 2024
New download: BD+C's February 2024 Market Intelligence Report
Building Design+Construction's monthly Market Intelligence Report offers a snapshot of the health of the U.S. building construction industry, including the commercial, multifamily, institutional, and industrial building sectors. This report tracks the latest metrics related to construction spending, demand for design services, contractor backlogs, and material price trends.
Industry Research | Jan 31, 2024
ASID identifies 11 design trends coming in 2024
The Trends Outlook Report by the American Society of Interior Designers (ASID) is the first of a three-part outlook series on interior design. This design trends report demonstrates the importance of connection and authenticity.

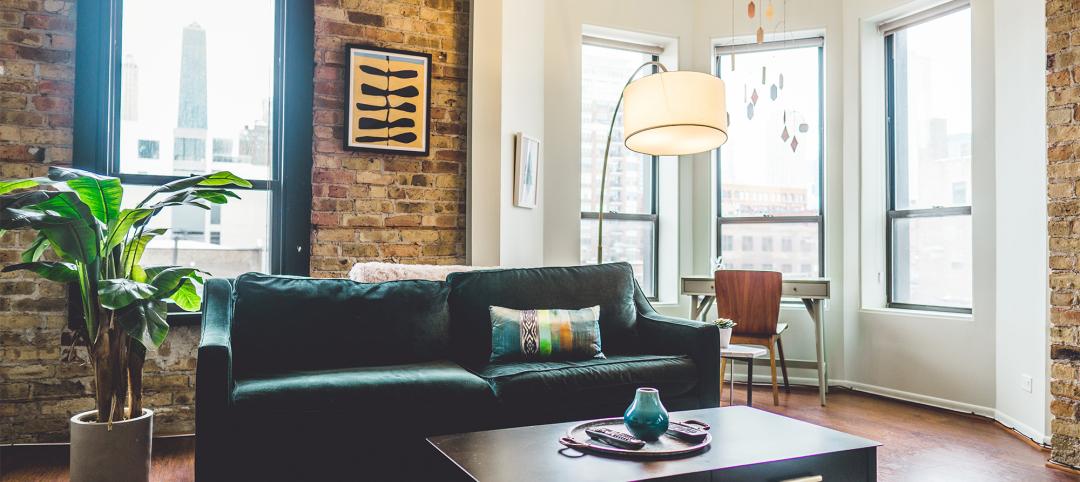
Apartments | Jan 26, 2024
New apartment supply: Top 5 metros delivering in 2024
Nationally, the total new apartment supply amounts to around 1.4 million units—well exceeding the apartment development historical average of 980,000 units.

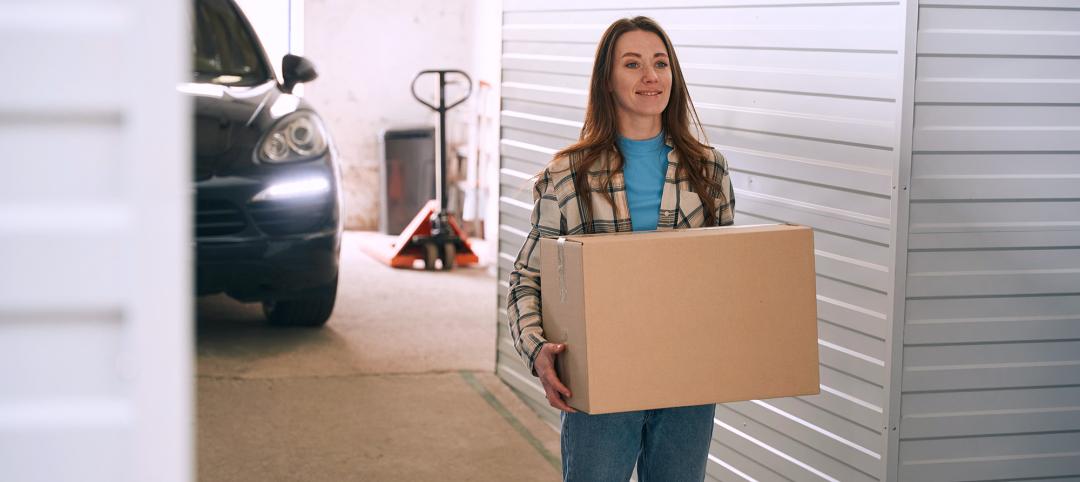
Self-Storage Facilities | Jan 25, 2024
One-quarter of self-storage renters are Millennials
Interest in self-storage has increased in over 75% of the top metros according to the latest StorageCafe survey of self-storage preferences. Today, Millennials make up 25% of all self-storage renters.

Industry Research | Jan 23, 2024
Leading economists forecast 4% growth in construction spending for nonresidential buildings in 2024
Spending on nonresidential buildings will see a modest 4% increase in 2024, after increasing by more than 20% last year according to The American Institute of Architects’ latest Consensus Construction Forecast. The pace will slow to just over 1% growth in 2025, a marked difference from the strong performance in 2023.

Construction Costs | Jan 22, 2024
Construction material prices continue to normalize despite ongoing challenges
Gordian’s most recent Quarterly Construction Cost Insights Report for Q4 2023 describes an industry still attempting to recover from the impact of COVID. This was complicated by inflation, weather, and geopolitical factors that resulted in widespread pricing adjustments throughout the construction materials industries.

Hotel Facilities | Jan 22, 2024
U.S. hotel construction is booming, with a record-high 5,964 projects in the pipeline
The hotel construction pipeline hit record project counts at Q4, with the addition of 260 projects and 21,287 rooms over last quarter, according to Lodging Econometrics.

Multifamily Housing | Jan 15, 2024
Multifamily rent growth rate unchanged at 0.3%
The National Multifamily Report by Yardi Matrix highlights the highs and lows of the multifamily market in 2023. Despite strong demand, rent growth remained unchanged at 0.3 percent.
Self-Storage Facilities | Jan 5, 2024
The state of self-storage in early 2024
As the housing market cools down, storage facilities suffer from lower occupancy and falling rates, according to the December 2023 Yardi Matrix National Self Storage Report.


