


Analysts at Lodging Econometrics (LE) reported for the second quarter of 2019, the total U.S. construction pipeline climbed to 5,653 projects/693,207 rooms, up 6% by projects and 9% by rooms year-over-year (YOY). Pipeline totals are just 230 projects shy of the all-time high of 5,883 projects/785,547 rooms reached in the second quarter of 2008.
Projects currently under construction stand at 1,727 projects/233,600 rooms with projects scheduled to start construction in the next 12 months at 2,552 projects/295,989 rooms. Both are at the highest levels since early 2008. Projects in the early planning stage stand at 1,374 projects/163,618 rooms.
In the first half of 2019, the industry opened 456 new hotels with 53,427 rooms. An additional 599 projects/66,300 rooms are expected to open by year-end. In 2020, the LE forecasts for new hotel openings continues to rise with 1,161 new hotels/129,531 rooms scheduled to open. In 2021, with a growth rate of 2.5%, 1,206 new hotels with 139,793 rooms are likely to open as a result of the current robust pipeline. Should all these hotels come to fruition, 2021 will register the highest count for new hotel openings since 2009.
Trendline analysis suggests that the pipeline is in a topping out formation as new project announcements into the pipeline in the second quarter are at 359 projects/ 44,895 rooms, their lowest count since the fourth quarter of 2014. Brand to brand conversions have also declined over the last year and are at the lowest level since the end of 2016.
Although government spending and consumer sentiment and spending remain strong, these declines can be attributed to business spending declines which have turned negative for the first time since early 2016. Declines are due primarily to the uncertainty caused by trade and tariff problems and the slowing global economy.
Leading Markets in The U.S. Hotel Construction Pipeline
At the end of the first half of 2019, analysts at Lodging Econometrics (L.E.) report that the top five markets with the largest hotel construction pipelines are New York City with 166 projects/28,231 rooms. Next are Dallas and Los Angeles with 162 projects/19,972 rooms and 158 projects/25,428 rooms, respectively. Houston follows with 146 projects/14,998 rooms, and Atlanta with 130 projects/17,280 rooms. With the exception of NYC and Houston, these top markets are at record high counts.
The top ten markets in the pipeline including the five markets mentioned above plus Nashville, Austin, Orlando, Detroit, and Charlotte account for 25% of the rooms in the total pipeline. Ten states claim a whopping 61% of the rooms in the pipeline: Texas, California, Florida, New York, Georgia, Tennessee, North Carolina, Michigan, Colorado, and Ohio.
For the first half of 2019, the U.S. has opened 456 new hotels/53,527 rooms with another 599 new hotels/66,300 rooms expected to open by year-end. Reflective of the robust pipeline, L.E.’s forecast for new hotel openings will continue to rise through 2021.
Twenty-five percent of the new hotels forecast to open between now and the 2021 year-end are concentrated in ten markets. These markets are New York City, Los Angeles, Orlando, Dallas, Atlanta, Nashville, Houston, Washington DC, Miami, and Phoenix. The top 25 markets are forecast to open 40% of the rooms expected to open.
Related Stories
Market Data | May 12, 2020
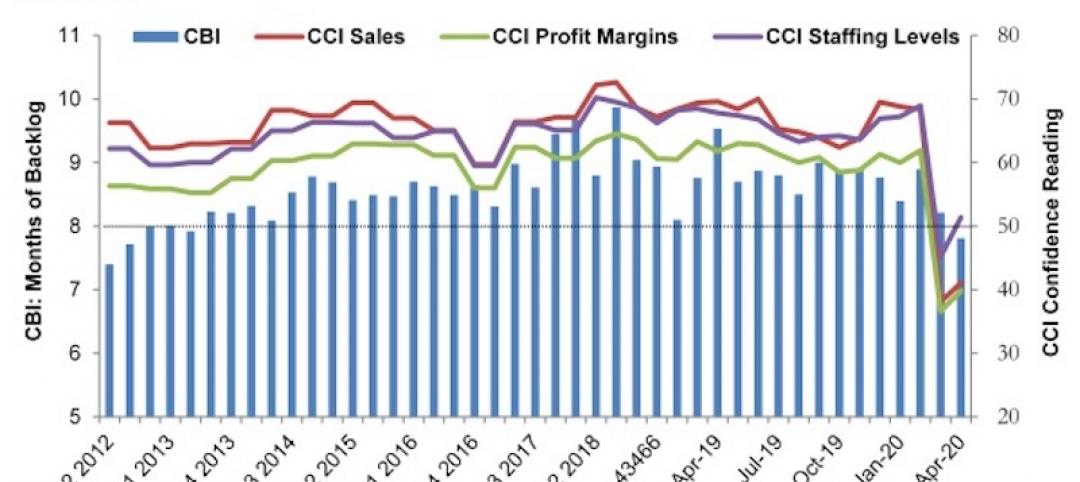
ABC’s Construction Backlog Indicator falls in April; Contractor Confidence rebounds from historic lows
Nonresidential construction backlog is down 0.4 months compared to the March 2020 ABC survey and 1.7 months from April 2019.

Market Data | May 12, 2020
6 must reads for the AEC industry today: May 12, 2020
A 13-point plan to reduce coronavirus deaths in nursing homes and Bjarke Ingels discusses building on Mars.

Market Data | May 11, 2020
Interest in eSports is booming amid COVID-19
The industry has proved largely immune to the COVID-19 pandemic due to its prompt transition into online formats and sudden spike in interest from traditional sports organizations.

Market Data | May 11, 2020
6 must reads for the AEC industry today: May 11, 2020
Nashville residential tower will rise 416 feet and the construction industry loses 975,000 jobs.

Market Data | May 8, 2020
Construction industry loses 975,000 jobs in April as new association survey shows deteriorating demand for construction projects
Association partner Procore also releases near real-time construction data measuring impacts of coronavirus as association calls for new measures.

Market Data | May 8, 2020
7 must reads for the AEC industry today: May 8, 2020
The death of the office and Colorado's first multifamily project to receive WELL Precertification.

Market Data | May 7, 2020
5 must reads for the AEC industry today: May 7, 2020
5 memory care communities with a strong sense of mission and making jobsites safer in the COVID-19 world.

Market Data | May 6, 2020
6 must reads for the AEC industry today: May 6, 2020
5 questions engineers will ask after COVID-19 and coronavirus threatens push for denser housing.

Market Data | May 5, 2020
5 must reads for the AEC industry today: May 5, 2020
A new temporary hospital pops up in N.J., and apartment firms' reactivation plans begin to take shape.

Market Data | May 4, 2020
6 must reads for the AEC industry today: May 4, 2020
How working from home is influencing design and is this the end of the open office?


