


In 2009, we met with Senior Facility Managers of four U.S. national laboratories to discuss a major limitation in the way they summarized their capital needs. As with most large organizations, they expressed capital needs in terms of deferred maintenance projects—things that needed to be fixed as determined by condition assessment (inspection or prescribed schedule). To put these needs in perspective, they computed a facility condition index (FCI), which is the ratio of deferred maintenance (D.M) costs to the replacement value of a building or portfolio.
Several years later, following the acquisition of Whitestone Research by CBRE Inc., it quickly became clear that major healthcare organizations around the world oftentimes employ a similar FCI based approach to their capital planning and prioritization decisions.
FACILITY CONDITION INDEX BREAKDOWN
According to a well-known scale developed initially for educational facilities in 1991, a facility is considered in poor condition if its FCI exceeds 90%. The shortcomings of the FCI approach are well-known, as results are not easily compared with alternative condition assessment approaches, and it does not contemplate methodologies for determining replacement values. These choices can become highly political for an organization that uses, as many do, the FCI as a key policy metric.
The basic concern of the laboratory facility managers was that the FCI did not represent the true condition of the facility in terms of safety, security, mission relevance, and other criteria that actually guide their decisions. FCI is also not a forecast or leading indicator that demonstrates consequences of alternative actions. These concerns led to a series of small projects that would eventually define a new approach to summarizing facility condition and prioritizing capital expenditures.
The new method, Risk Scanning, meets three requirements identified in our original meeting. The process must not rely on expensive inspections, must incorporate multiple (customizable) criteria, and the outcomes must be expressed as a simple monetary value.
This approach has universal applicability for laboratories and for large, corporate occupiers. In addition, we have found this approach to be particularly relevant for healthcare organizations today, given the extraordinary economic and regulatory pressures that have become a reality for the industry.
RISK SCANNING
Risk Scanning assumes that buildings or other assets can be reduced to an inventory of components (roof, HVAC equipment, plumbing fixtures, etc.). Each component has a “survivor” curve that relates its age to the likelihood of its failure in the future, little different than an actuarial calculation for an insurance policy. And each component, should it fail, could have consequences for the building operation. Below, Figure 1 illustrates how this data could be used as a simple sort by probability of failure, consequence of failure, or replacement cost.
Figure 1
A more useful view of this data combines knowledge of the probability of failure and the potential consequences as the Risk Facility Managers implicitly consider when scheduling repairs. For example, a new light bulb in a closet would be low risk (low likelihood of failure, low impact on safety, security, mission, etc.), while a roof or electrical panel, far beyond their expected service life would be a high risk. Individual component risk ratings can be aggregated into risk maps by building, consequence type, or aggregated at the portfolio level.
Another example is a risk scan of a data center built in 1980, as shown in Figure 2. Risk is summarized by three consequences or threats of failure – mission, productivity and safety. The “Loss Intensity” is the measure (low, medium, high) of the impact of failure. Each cell in the tables is the sum of the replacement value of each component. For instance, in the first table there are high risk (red) components with replacement values totaling $374,210.
Figure 2: Dashboard showing risk by consequence
One way to represent overall risk is to sum across the individual tables in Figure 2, by risk category (red = high, yellow = moderate, green = low) to produce a single risk column, as shown in Figure 3. This shows that the costs to replace components rated high risk in 2015 for any reason (mission, productivity, or safety) were $2,349,315. Note that some components are high risk for multiple reasons.
Figure 3: Risk Column
The calculation of the column can be modified for different purposes. The ratings from the dashboard could be weighted to reflect management priorities. The likelihood of failure, and consequent migration of risk ratings, could be estimated for a range of years, as shown for the period 2015-2019.
COMPARING THE FCI WITH RISK SCANNING
The data center example provides a useful comparison of the output from a simple condition assessment with the additional data provided by Risk Scanning.
A conventional facility condition assessment using a life cycle cost model indicated that 75 components had exceeded their service life. The costs of replacing these would be $4,771,159. Considering this amount to be deferred maintenance (D.M.), the FCI would be 5% (given $100 million replacement value). This would be summarized as a building in “fair” condition.
Figure 4
A Risk Scan of the component inventory indicates that 13 components are at high risk, and the costs of replacing these would be $2,349,315. This is less than half the costs of replacements by a simple service life-assessment. An FCI based on high risk components would be 2.2%, indicating a building in “good” condition.
In this case, with the additional information provided by Risk Scanning, the facility would be considered in better condition than with the simple condition assessment. Moreover, the risk scan would provide a rating for all components—including those not yet considered as deferred maintenance—as a basis for anticipating future needs and prioritization.
CONCLUSION
The Risk Scanning approach uses well-known risk analytics applied to pre-existing facility data to provide a richer view of facility condition more consistent with actual management decision making. In practice, limited funding is directed to those repairs and replacements that address corporate priorities, such as safety, security, and mission achievement. For healthcare systems, this approach can provide critical insight for decision-making about capital deployment where actionable criteria are not established or where data is limited.
About the Authors
Peter Lufkin is Senior Managing Director and Luca Romani is Senior Analyst with CBRE Whitestone.
Related Stories
| Feb 15, 2011
AIA on President Obama's proposed $1 billion investment in energy conservation
The President’s budget increases the value of investment in energy conservation in commercial buildings by roughly $1 billion, reports AIA 2011 President Clark Manus, FAIA. The significant increase from the current tax deduction of $1.80 per sq. ft. now on the books is an increase for which the AIA has been advocating in order to encourage energy conservation.

| Feb 14, 2011
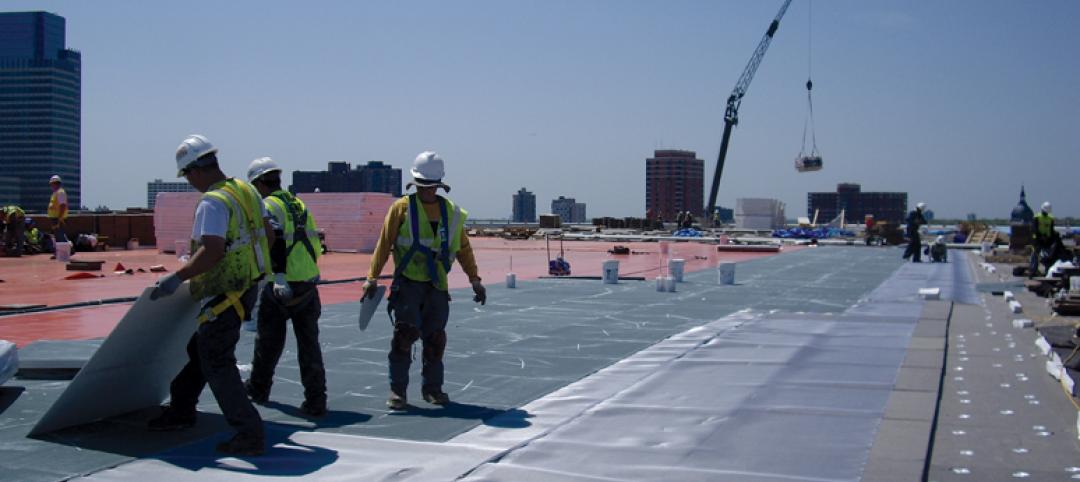
Sustainable Roofing: A Whole-Building Approach
According to sustainability experts, the first step toward designing an energy-efficient roofing system is to see roof materials and systems as an integral component of the enclosure and the building as a whole. Earn 1.0 AIA/CES learning units by studying this article and successfully completing the online exam.
| Feb 11, 2011
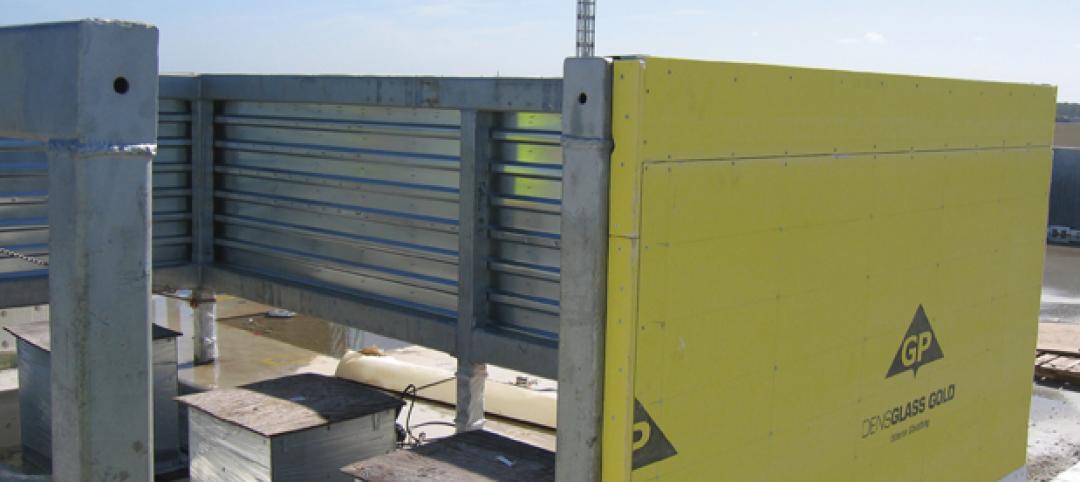
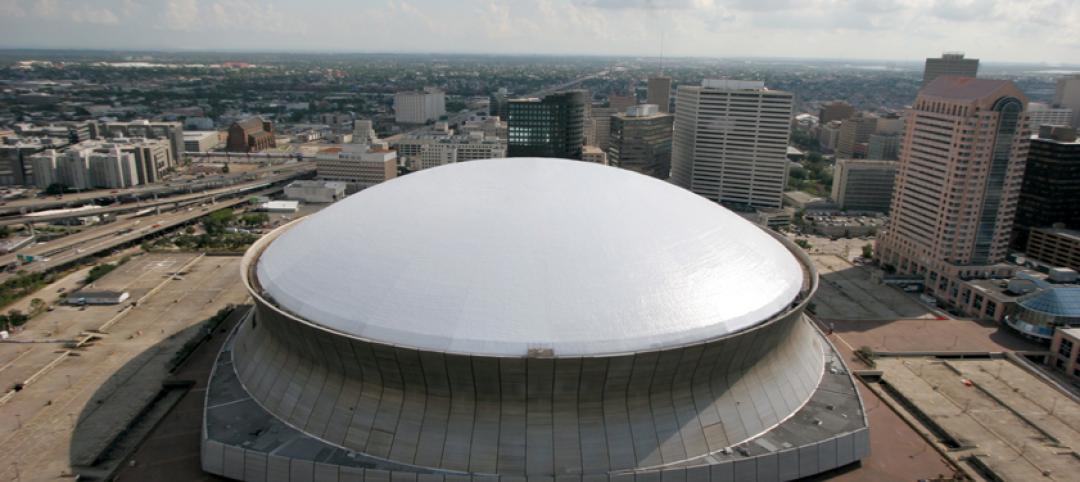
Four Products That Stand Up to Hurricanes
What do a panelized wall system, a newly developed roof hatch, spray polyurethane foam, and a custom-made curtain wall have in common? They’ve been extensively researched and tested for their ability to take abuse from the likes of Hurricane Katrina.
| Feb 11, 2011
RS Means Cost Comparison Chart: Office Buildings
This month's RS Means Cost Comparison Chart focuses on office building construction.
| Feb 11, 2011
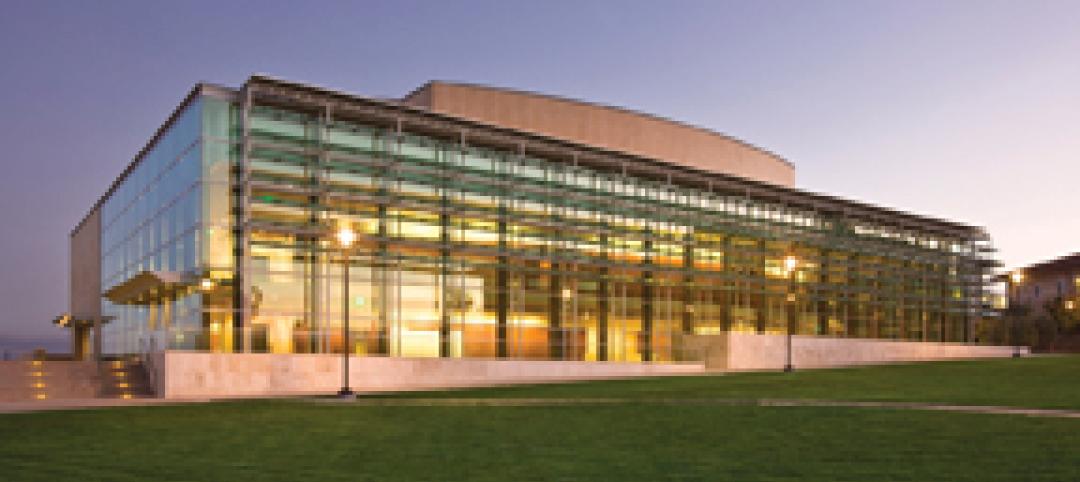
Sustainable features on the bill for dual-building performing arts center at Soka University of America
The $73 million Soka University of America’s new performing arts center and academic complex recently opened on the school’s Aliso Viejo, Calif., campus. McCarthy Building Companies and Zimmer Gunsul Frasca Architects collaborated on the two-building project. One is a three-story, 47,836-sf facility with a grand reception lobby, a 1,200-seat auditorium, and supports spaces. The other is a four-story, 48,974-sf facility with 11 classrooms, 29 faculty offices, a 150-seat black box theater, rehearsal/dance studio, and support spaces. The project, which has a green roof, solar panels, operable windows, and sun-shading devices, is going for LEED Silver.
| Feb 11, 2011
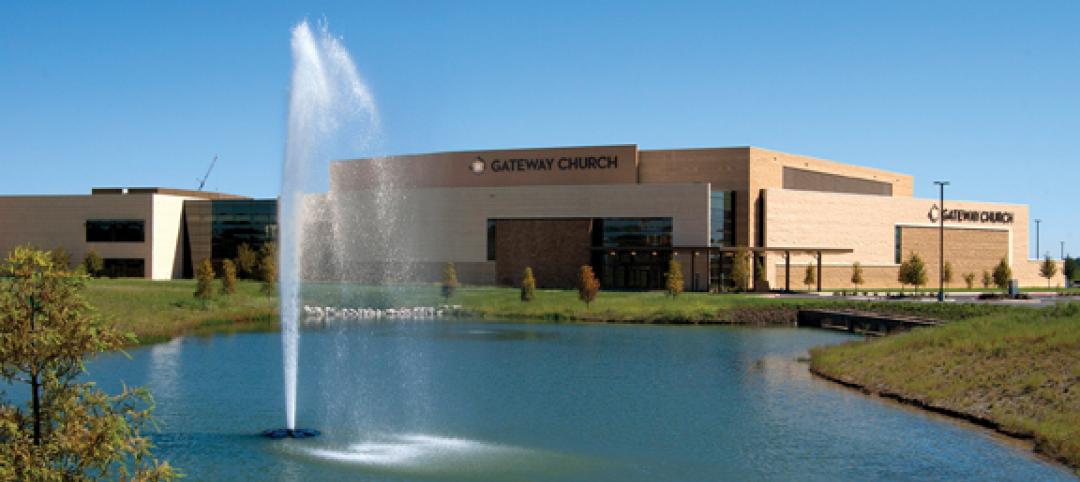
BIM-enabled Texas church complex can broadcast services in high-def
After two years of design and construction, members of the Gateway Church in Southland, Texas, were able to attend services in their new 4,000-seat facility in late 2010. Located on a 180-acre site, the 205,000-sf complex has six auditoriums, including a massive 200,000-sf Worship Center, complete with catwalks, top-end audio and video system, and high-definition broadcast capabilities. BIM played a significant role in the building’s design and construction. Balfour Beatty Construction and Beck Architecture formed the nucleus of the Building Team.
| Feb 11, 2011
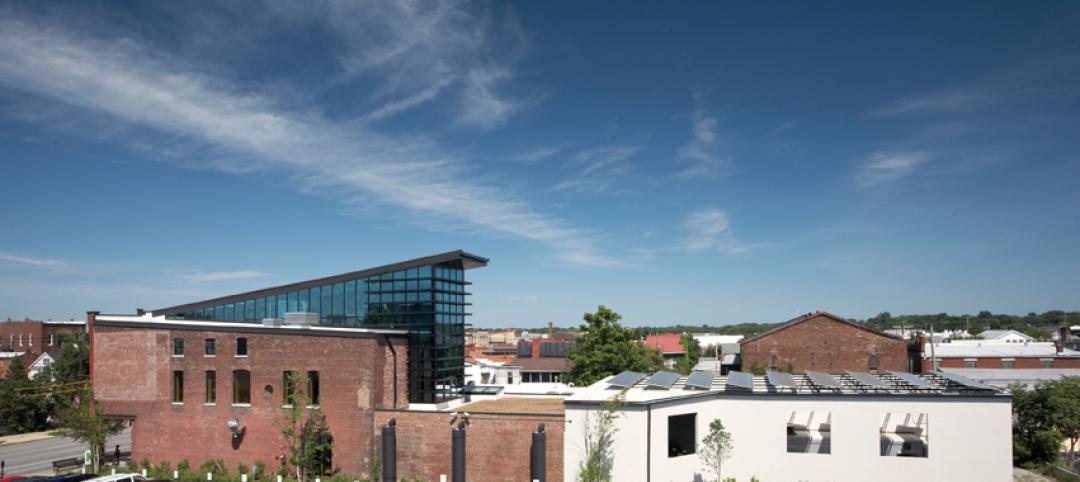
Kentucky’s first green adaptive reuse project earns Platinum
(FER) studio, Inglewood, Calif., converted a 115-year-old former dry goods store in Louisville, Ky., into a 10,175-sf mixed-use commercial building earned LEED Platinum and holds the distinction of being the state’s first adaptive reuse project to earn any LEED rating. The facility, located in the East Market District, houses a gallery, event space, offices, conference space, and a restaurant. Sustainable elements that helped the building reach its top LEED rating include xeriscaping, a green roof, rainwater collection and reuse, 12 geothermal wells, 81 solar panels, a 1,100-gallon ice storage system (off-grid energy efficiency is 68%) and the reuse and recycling of construction materials. Local firm Peters Construction served as GC.
| Feb 11, 2011
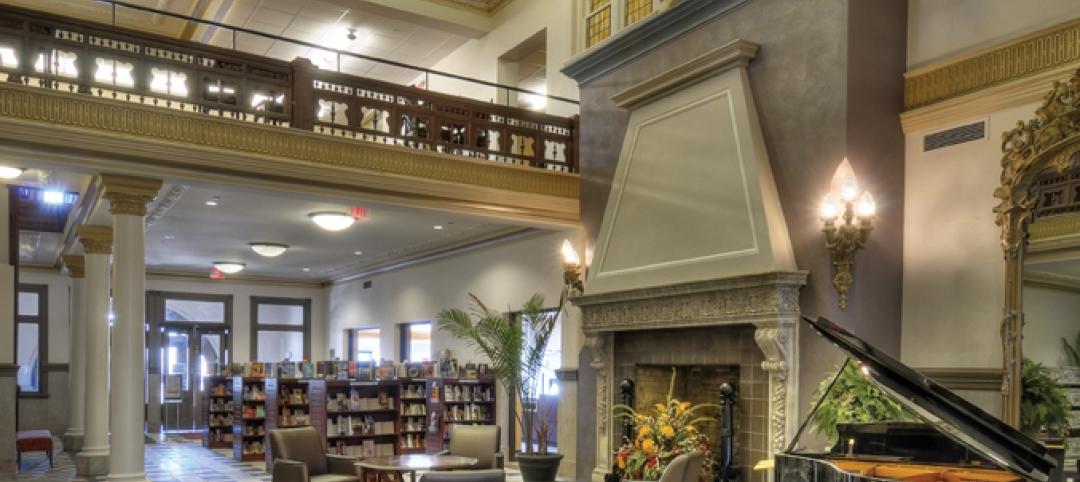
Former Richardson Romanesque hotel now houses books, not beds
The Piqua (Ohio) Public Library was once a late 19th-century hotel that sat vacant and deteriorating for years before a $12.3 million adaptive reuse project revitalized the 1891 building. The design team of PSA-Dewberry, MKC Associates, and historic preservation specialist Jeff Wray Associates collaborated on the restoration of the 80,000-sf Richardson Romanesque building, once known as the Fort Piqua Hotel. The team restored a mezzanine above the lobby and repaired historic windows, skylight, massive fireplace, and other historic details. The basement, with its low ceiling and stacked stone walls, was turned into a castle-like children’s center. The Piqua Historical Museum is also located within the building.


