


In 2009, we met with Senior Facility Managers of four U.S. national laboratories to discuss a major limitation in the way they summarized their capital needs. As with most large organizations, they expressed capital needs in terms of deferred maintenance projects—things that needed to be fixed as determined by condition assessment (inspection or prescribed schedule). To put these needs in perspective, they computed a facility condition index (FCI), which is the ratio of deferred maintenance (D.M) costs to the replacement value of a building or portfolio.
Several years later, following the acquisition of Whitestone Research by CBRE Inc., it quickly became clear that major healthcare organizations around the world oftentimes employ a similar FCI based approach to their capital planning and prioritization decisions.
FACILITY CONDITION INDEX BREAKDOWN
According to a well-known scale developed initially for educational facilities in 1991, a facility is considered in poor condition if its FCI exceeds 90%. The shortcomings of the FCI approach are well-known, as results are not easily compared with alternative condition assessment approaches, and it does not contemplate methodologies for determining replacement values. These choices can become highly political for an organization that uses, as many do, the FCI as a key policy metric.
The basic concern of the laboratory facility managers was that the FCI did not represent the true condition of the facility in terms of safety, security, mission relevance, and other criteria that actually guide their decisions. FCI is also not a forecast or leading indicator that demonstrates consequences of alternative actions. These concerns led to a series of small projects that would eventually define a new approach to summarizing facility condition and prioritizing capital expenditures.
The new method, Risk Scanning, meets three requirements identified in our original meeting. The process must not rely on expensive inspections, must incorporate multiple (customizable) criteria, and the outcomes must be expressed as a simple monetary value.
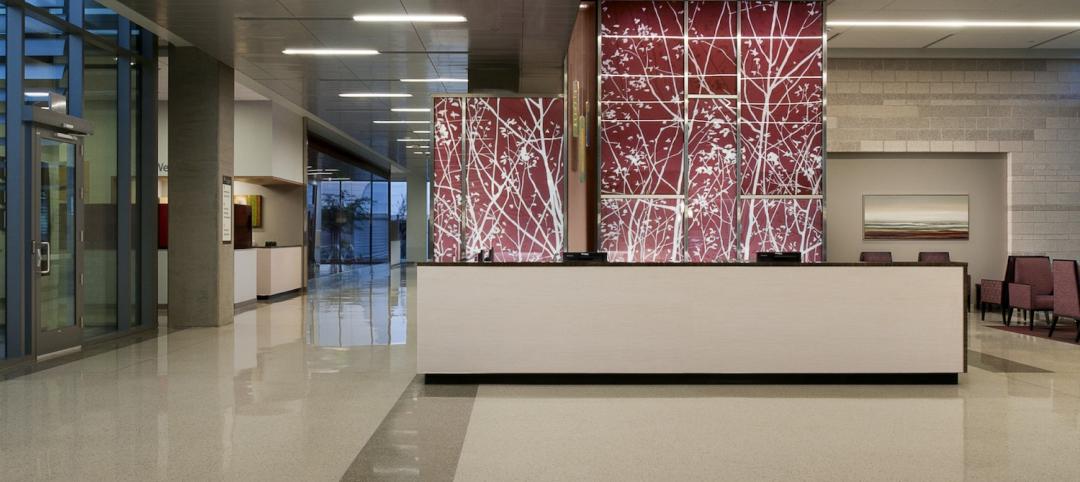
This approach has universal applicability for laboratories and for large, corporate occupiers. In addition, we have found this approach to be particularly relevant for healthcare organizations today, given the extraordinary economic and regulatory pressures that have become a reality for the industry.
RISK SCANNING
Risk Scanning assumes that buildings or other assets can be reduced to an inventory of components (roof, HVAC equipment, plumbing fixtures, etc.). Each component has a “survivor” curve that relates its age to the likelihood of its failure in the future, little different than an actuarial calculation for an insurance policy. And each component, should it fail, could have consequences for the building operation. Below, Figure 1 illustrates how this data could be used as a simple sort by probability of failure, consequence of failure, or replacement cost.
Figure 1
A more useful view of this data combines knowledge of the probability of failure and the potential consequences as the Risk Facility Managers implicitly consider when scheduling repairs. For example, a new light bulb in a closet would be low risk (low likelihood of failure, low impact on safety, security, mission, etc.), while a roof or electrical panel, far beyond their expected service life would be a high risk. Individual component risk ratings can be aggregated into risk maps by building, consequence type, or aggregated at the portfolio level.
Another example is a risk scan of a data center built in 1980, as shown in Figure 2. Risk is summarized by three consequences or threats of failure – mission, productivity and safety. The “Loss Intensity” is the measure (low, medium, high) of the impact of failure. Each cell in the tables is the sum of the replacement value of each component. For instance, in the first table there are high risk (red) components with replacement values totaling $374,210.
Figure 2: Dashboard showing risk by consequence
One way to represent overall risk is to sum across the individual tables in Figure 2, by risk category (red = high, yellow = moderate, green = low) to produce a single risk column, as shown in Figure 3. This shows that the costs to replace components rated high risk in 2015 for any reason (mission, productivity, or safety) were $2,349,315. Note that some components are high risk for multiple reasons.
Figure 3: Risk Column
The calculation of the column can be modified for different purposes. The ratings from the dashboard could be weighted to reflect management priorities. The likelihood of failure, and consequent migration of risk ratings, could be estimated for a range of years, as shown for the period 2015-2019.
COMPARING THE FCI WITH RISK SCANNING
The data center example provides a useful comparison of the output from a simple condition assessment with the additional data provided by Risk Scanning.
A conventional facility condition assessment using a life cycle cost model indicated that 75 components had exceeded their service life. The costs of replacing these would be $4,771,159. Considering this amount to be deferred maintenance (D.M.), the FCI would be 5% (given $100 million replacement value). This would be summarized as a building in “fair” condition.
Figure 4
A Risk Scan of the component inventory indicates that 13 components are at high risk, and the costs of replacing these would be $2,349,315. This is less than half the costs of replacements by a simple service life-assessment. An FCI based on high risk components would be 2.2%, indicating a building in “good” condition.
In this case, with the additional information provided by Risk Scanning, the facility would be considered in better condition than with the simple condition assessment. Moreover, the risk scan would provide a rating for all components—including those not yet considered as deferred maintenance—as a basis for anticipating future needs and prioritization.
CONCLUSION
The Risk Scanning approach uses well-known risk analytics applied to pre-existing facility data to provide a richer view of facility condition more consistent with actual management decision making. In practice, limited funding is directed to those repairs and replacements that address corporate priorities, such as safety, security, and mission achievement. For healthcare systems, this approach can provide critical insight for decision-making about capital deployment where actionable criteria are not established or where data is limited.
About the Authors
Peter Lufkin is Senior Managing Director and Luca Romani is Senior Analyst with CBRE Whitestone.
Related Stories
| Oct 30, 2014
CannonDesign releases guide for specifying flooring in healthcare settings
The new report, "Flooring Applications in Healthcare Settings," compares and contrasts different flooring types in the context of parameters such as health and safety impact, design and operational issues, environmental considerations, economics, and product options.

| Oct 30, 2014
Perkins Eastman and Lee, Burkhart, Liu to merge practices
The merger will significantly build upon the established practices—particularly healthcare—of both firms and diversify their combined expertise, particularly on the West Coast.

| Oct 29, 2014
Better guidance for appraising green buildings is steadily emerging
The Appraisal Foundation is striving to improve appraisers’ understanding of green valuation.

| Oct 29, 2014
Increasing number of design projects meeting carbon reduction targets, says AIA report
Of the 2,464 projects accounted for in AIA's 2030 Commitment 2013 Progress Report, 401 are meeting the 60% carbon reduction target—a 200% increase from 2012.

Sponsored | | Oct 29, 2014
What’s the difference between your building’s coating chalking and fading?
While the reasons for chalk and fade are different, both occurrences are something to watch for. SPONSORED CONTENT
Sponsored | | Oct 29, 2014
Historic Washington elementary school incorporates modular design
More and more architects and designers are leveraging modern modular building techniques for expansion projects planned on historical sites. SPONSORED CONTENT

| Oct 29, 2014
Diller Scofidio + Renfro selected to design Olympic Museum in Colorado Springs
The museum is slated for an early 2018 completion, and will include a hall of fame, theater, retail space, and a 20,000-sf hall that will showcase the history of the Olympics and Paralympics.

Smart Buildings | Oct 29, 2014
SCAPE’s 'living breakwaters' resiliency development wins 2014 Buckminster Fuller Challenge
New York-based landscape architecture firm SCAPE won the Buckminster Fuller Institute’s 2014 Fuller Challenge, billed as socially responsible design’s highest award.

| Oct 28, 2014
4 keys to mastering 'design thinking' and the iteration process
When using design thinking and iteration, we’ll sometimes spend multiple days iterating idea after idea, heads down, only to realize we still don’t have it right, writes HDR's Amy Lussetto. She offers tips for success with these idea-nurturing tools.

| Oct 28, 2014
Miami accepts more modest plan to renovate its convention center
The city of Miami has awarded an $11 million contract for its on-again, off-again convention center renovation to Denver-based Fentress Architects, which will serve as the design criteria professional on this project.


