


In 2009, we met with Senior Facility Managers of four U.S. national laboratories to discuss a major limitation in the way they summarized their capital needs. As with most large organizations, they expressed capital needs in terms of deferred maintenance projects—things that needed to be fixed as determined by condition assessment (inspection or prescribed schedule). To put these needs in perspective, they computed a facility condition index (FCI), which is the ratio of deferred maintenance (D.M) costs to the replacement value of a building or portfolio.
Several years later, following the acquisition of Whitestone Research by CBRE Inc., it quickly became clear that major healthcare organizations around the world oftentimes employ a similar FCI based approach to their capital planning and prioritization decisions.
FACILITY CONDITION INDEX BREAKDOWN
According to a well-known scale developed initially for educational facilities in 1991, a facility is considered in poor condition if its FCI exceeds 90%. The shortcomings of the FCI approach are well-known, as results are not easily compared with alternative condition assessment approaches, and it does not contemplate methodologies for determining replacement values. These choices can become highly political for an organization that uses, as many do, the FCI as a key policy metric.
The basic concern of the laboratory facility managers was that the FCI did not represent the true condition of the facility in terms of safety, security, mission relevance, and other criteria that actually guide their decisions. FCI is also not a forecast or leading indicator that demonstrates consequences of alternative actions. These concerns led to a series of small projects that would eventually define a new approach to summarizing facility condition and prioritizing capital expenditures.
The new method, Risk Scanning, meets three requirements identified in our original meeting. The process must not rely on expensive inspections, must incorporate multiple (customizable) criteria, and the outcomes must be expressed as a simple monetary value.
This approach has universal applicability for laboratories and for large, corporate occupiers. In addition, we have found this approach to be particularly relevant for healthcare organizations today, given the extraordinary economic and regulatory pressures that have become a reality for the industry.
RISK SCANNING
Risk Scanning assumes that buildings or other assets can be reduced to an inventory of components (roof, HVAC equipment, plumbing fixtures, etc.). Each component has a “survivor” curve that relates its age to the likelihood of its failure in the future, little different than an actuarial calculation for an insurance policy. And each component, should it fail, could have consequences for the building operation. Below, Figure 1 illustrates how this data could be used as a simple sort by probability of failure, consequence of failure, or replacement cost.
Figure 1
A more useful view of this data combines knowledge of the probability of failure and the potential consequences as the Risk Facility Managers implicitly consider when scheduling repairs. For example, a new light bulb in a closet would be low risk (low likelihood of failure, low impact on safety, security, mission, etc.), while a roof or electrical panel, far beyond their expected service life would be a high risk. Individual component risk ratings can be aggregated into risk maps by building, consequence type, or aggregated at the portfolio level.
Another example is a risk scan of a data center built in 1980, as shown in Figure 2. Risk is summarized by three consequences or threats of failure – mission, productivity and safety. The “Loss Intensity” is the measure (low, medium, high) of the impact of failure. Each cell in the tables is the sum of the replacement value of each component. For instance, in the first table there are high risk (red) components with replacement values totaling $374,210.
Figure 2: Dashboard showing risk by consequence
One way to represent overall risk is to sum across the individual tables in Figure 2, by risk category (red = high, yellow = moderate, green = low) to produce a single risk column, as shown in Figure 3. This shows that the costs to replace components rated high risk in 2015 for any reason (mission, productivity, or safety) were $2,349,315. Note that some components are high risk for multiple reasons.
Figure 3: Risk Column
The calculation of the column can be modified for different purposes. The ratings from the dashboard could be weighted to reflect management priorities. The likelihood of failure, and consequent migration of risk ratings, could be estimated for a range of years, as shown for the period 2015-2019.
COMPARING THE FCI WITH RISK SCANNING
The data center example provides a useful comparison of the output from a simple condition assessment with the additional data provided by Risk Scanning.
A conventional facility condition assessment using a life cycle cost model indicated that 75 components had exceeded their service life. The costs of replacing these would be $4,771,159. Considering this amount to be deferred maintenance (D.M.), the FCI would be 5% (given $100 million replacement value). This would be summarized as a building in “fair” condition.
Figure 4
A Risk Scan of the component inventory indicates that 13 components are at high risk, and the costs of replacing these would be $2,349,315. This is less than half the costs of replacements by a simple service life-assessment. An FCI based on high risk components would be 2.2%, indicating a building in “good” condition.
In this case, with the additional information provided by Risk Scanning, the facility would be considered in better condition than with the simple condition assessment. Moreover, the risk scan would provide a rating for all components—including those not yet considered as deferred maintenance—as a basis for anticipating future needs and prioritization.
CONCLUSION
The Risk Scanning approach uses well-known risk analytics applied to pre-existing facility data to provide a richer view of facility condition more consistent with actual management decision making. In practice, limited funding is directed to those repairs and replacements that address corporate priorities, such as safety, security, and mission achievement. For healthcare systems, this approach can provide critical insight for decision-making about capital deployment where actionable criteria are not established or where data is limited.
About the Authors
Peter Lufkin is Senior Managing Director and Luca Romani is Senior Analyst with CBRE Whitestone.
Related Stories

| Nov 24, 2014
Midsize construction firms see a brighter business horizon
Uncertainty about government spending clouds an otherwise positive economic outlook among 59 middle market construction firms polled recently by GE Capital.

| Nov 24, 2014
Adrian Smith + Gordon Gill-designed crystalline tower breaks ground in southwestern China
Fitted with an LED façade, the 468-meter Greenland Tower Chengdu will act as a light sculpture for the city of Chengdu.

| Nov 21, 2014
Rental apartment construction soars to 27-year high: WSJ report
The multifamily sector is now outpacing the peak construction rate in the previous housing cycle, in 2006, according to the WSJ.

| Nov 21, 2014
Nelson adds to its stable with EHS Design acquisition
This represents Nelson’s fifth merger or acquisition in 2014, during which the firm’s net fee revenue has increased by 60% to $65 million.

| Nov 21, 2014
Nonresidential Construction Index rises in fourth quarter
There are a number of reasons for optimism among respondents of FMI's quarterly Nonresidential Construction Index survey, including healthier backlogs and low inflation.

| Nov 21, 2014
NCARB: Number of architects in U.S. grows 1.6% in 2014, surpasses 107,500
The architecture profession continues to grow along with a gradually recovering economy, based on the results of the 2014 Survey of Architectural Registration Boards, conducted by the National Council of Architectural Registration Boards.

| Nov 20, 2014
Lean Led Design: How Building Teams can cut costs, reduce waste in healthcare construction projects
Healthcare organizations are under extreme pressure to reduce costs, writes CBRE Healthcare's Lora Schwartz. Tools like Lean Led Design are helping them cope.
| Nov 19, 2014
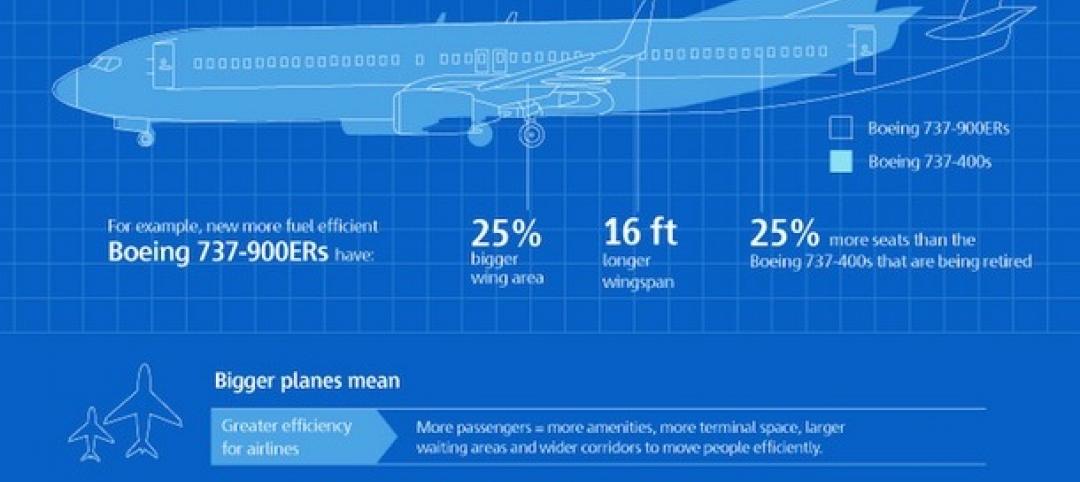
The evolution of airport design and construction [infographic]
Safety, consumer demand, and the new economics of flight are three of the major factors shaping how airlines and airport officials are approaching the need for upgrades and renovations, writes Skanska USA's MacAdam Glinn.

| Nov 19, 2014
Construction unemployment hits eight-year low, some states struggle to find qualified labor
The construction industry, whose workforce was decimated during the last recession, is slowly getting back on its feet. However, in certain markets—especially those where oil drilling and production have been prospering—construction workers can still be scarce.

Sponsored | | Nov 19, 2014
3 technology trends on the horizon
As technology continues to evolve exponentially, construction firms have ongoing opportunities to enhance the quality, speed, and efficiency of building projects and processes. SPONSORED CONTENT


