


In 2009, we met with Senior Facility Managers of four U.S. national laboratories to discuss a major limitation in the way they summarized their capital needs. As with most large organizations, they expressed capital needs in terms of deferred maintenance projects—things that needed to be fixed as determined by condition assessment (inspection or prescribed schedule). To put these needs in perspective, they computed a facility condition index (FCI), which is the ratio of deferred maintenance (D.M) costs to the replacement value of a building or portfolio.
Several years later, following the acquisition of Whitestone Research by CBRE Inc., it quickly became clear that major healthcare organizations around the world oftentimes employ a similar FCI based approach to their capital planning and prioritization decisions.
FACILITY CONDITION INDEX BREAKDOWN
According to a well-known scale developed initially for educational facilities in 1991, a facility is considered in poor condition if its FCI exceeds 90%. The shortcomings of the FCI approach are well-known, as results are not easily compared with alternative condition assessment approaches, and it does not contemplate methodologies for determining replacement values. These choices can become highly political for an organization that uses, as many do, the FCI as a key policy metric.
The basic concern of the laboratory facility managers was that the FCI did not represent the true condition of the facility in terms of safety, security, mission relevance, and other criteria that actually guide their decisions. FCI is also not a forecast or leading indicator that demonstrates consequences of alternative actions. These concerns led to a series of small projects that would eventually define a new approach to summarizing facility condition and prioritizing capital expenditures.
The new method, Risk Scanning, meets three requirements identified in our original meeting. The process must not rely on expensive inspections, must incorporate multiple (customizable) criteria, and the outcomes must be expressed as a simple monetary value.
This approach has universal applicability for laboratories and for large, corporate occupiers. In addition, we have found this approach to be particularly relevant for healthcare organizations today, given the extraordinary economic and regulatory pressures that have become a reality for the industry.
RISK SCANNING
Risk Scanning assumes that buildings or other assets can be reduced to an inventory of components (roof, HVAC equipment, plumbing fixtures, etc.). Each component has a “survivor” curve that relates its age to the likelihood of its failure in the future, little different than an actuarial calculation for an insurance policy. And each component, should it fail, could have consequences for the building operation. Below, Figure 1 illustrates how this data could be used as a simple sort by probability of failure, consequence of failure, or replacement cost.
Figure 1
A more useful view of this data combines knowledge of the probability of failure and the potential consequences as the Risk Facility Managers implicitly consider when scheduling repairs. For example, a new light bulb in a closet would be low risk (low likelihood of failure, low impact on safety, security, mission, etc.), while a roof or electrical panel, far beyond their expected service life would be a high risk. Individual component risk ratings can be aggregated into risk maps by building, consequence type, or aggregated at the portfolio level.
Another example is a risk scan of a data center built in 1980, as shown in Figure 2. Risk is summarized by three consequences or threats of failure – mission, productivity and safety. The “Loss Intensity” is the measure (low, medium, high) of the impact of failure. Each cell in the tables is the sum of the replacement value of each component. For instance, in the first table there are high risk (red) components with replacement values totaling $374,210.
Figure 2: Dashboard showing risk by consequence
One way to represent overall risk is to sum across the individual tables in Figure 2, by risk category (red = high, yellow = moderate, green = low) to produce a single risk column, as shown in Figure 3. This shows that the costs to replace components rated high risk in 2015 for any reason (mission, productivity, or safety) were $2,349,315. Note that some components are high risk for multiple reasons.
Figure 3: Risk Column
The calculation of the column can be modified for different purposes. The ratings from the dashboard could be weighted to reflect management priorities. The likelihood of failure, and consequent migration of risk ratings, could be estimated for a range of years, as shown for the period 2015-2019.
COMPARING THE FCI WITH RISK SCANNING
The data center example provides a useful comparison of the output from a simple condition assessment with the additional data provided by Risk Scanning.
A conventional facility condition assessment using a life cycle cost model indicated that 75 components had exceeded their service life. The costs of replacing these would be $4,771,159. Considering this amount to be deferred maintenance (D.M.), the FCI would be 5% (given $100 million replacement value). This would be summarized as a building in “fair” condition.
Figure 4
A Risk Scan of the component inventory indicates that 13 components are at high risk, and the costs of replacing these would be $2,349,315. This is less than half the costs of replacements by a simple service life-assessment. An FCI based on high risk components would be 2.2%, indicating a building in “good” condition.
In this case, with the additional information provided by Risk Scanning, the facility would be considered in better condition than with the simple condition assessment. Moreover, the risk scan would provide a rating for all components—including those not yet considered as deferred maintenance—as a basis for anticipating future needs and prioritization.
CONCLUSION
The Risk Scanning approach uses well-known risk analytics applied to pre-existing facility data to provide a richer view of facility condition more consistent with actual management decision making. In practice, limited funding is directed to those repairs and replacements that address corporate priorities, such as safety, security, and mission achievement. For healthcare systems, this approach can provide critical insight for decision-making about capital deployment where actionable criteria are not established or where data is limited.
About the Authors
Peter Lufkin is Senior Managing Director and Luca Romani is Senior Analyst with CBRE Whitestone.
Related Stories
 Campus, the Building Team took advantage of the sites natural coastal g")
| Dec 28, 2014
AIA course: Enhancing interior comfort while improving overall building efficacy
Providing more comfortable conditions to building occupants has become a top priority in today’s interior designs. This course is worth 1.0 AIA LU/HSW.

| Dec 28, 2014
6 trends steering today's college residence halls
University students want more in a residence hall than just a place to sleep. They want a space that reflects their style of living and learning.
")
| Dec 28, 2014
Using energy modeling to increase project value [AIA course]
This course, worth 1.0 AIA LU/HSW, explores how to increase project value through energy modeling, as well as how to conduct quick payback and net present value studies to identify which energy strategies are most viable for the project.
| Dec 28, 2014
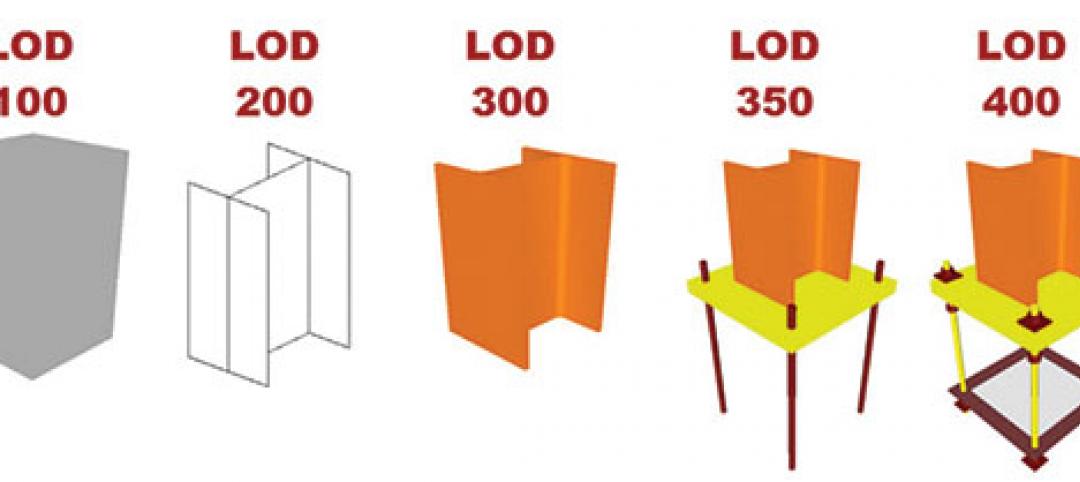
The lowdown on LODs: Bringing clarity to BIM
These days, BIM is par for the course across most facets of design. But a lot of the conversation surrounding BIM still lacks clarity due to ambiguous terminology, a lack of clear-cut guiding illustrations, and widely varying implementation, writes GS&P's John Scannell.

| Dec 28, 2014
The future of airport terminal design: destination status, five-star amenities, stress-free travel
Taking a cue from the hospitality industry, airport executives are seeking to make their facilities feel more like destinations, writes HOK's Richard Gammon.

| Dec 28, 2014
10 key design interventions for a healthier, happier, and more productive workplace
Numerous studies and mountains of evidence confirm what common sense has long suggested: healthy, happier workers are more productive, more likely to collaborate with colleagues, and more likely to innovate in ways that benefit the bottom line, writes Gensler's Kirsten Ritchie.

| Dec 28, 2014
7 fresh retail design strategies
Generic ‘boxes’ and indifferent service won’t cut it with today’s savvy shoppers. Retailers are seeking a technology-rich-but-handmade vibe, plus greater speed to market and adaptability.

| Dec 28, 2014
Workplace design trends: Make way for the Millennials
Driven by changing work styles, mobile technology, and the growing presence of Millennials, today’s workplaces are changing, mostly for the better. We examine the top office design trends.

| Dec 28, 2014
AIA: Commercial glass façade and door systems
When it comes to selecting fenestration systems—particularly glass facades and door systems—a number of factors come into play, requiring a thorough evaluation of a project’s individual requirements.

| Dec 28, 2014
10 essential habits of successful architects
Want to take the next step as a design processional? John Gresko, Senior Project Architect with HDR, explores the traits that many great architects possess.


