


In 2009, we met with Senior Facility Managers of four U.S. national laboratories to discuss a major limitation in the way they summarized their capital needs. As with most large organizations, they expressed capital needs in terms of deferred maintenance projects—things that needed to be fixed as determined by condition assessment (inspection or prescribed schedule). To put these needs in perspective, they computed a facility condition index (FCI), which is the ratio of deferred maintenance (D.M) costs to the replacement value of a building or portfolio.
Several years later, following the acquisition of Whitestone Research by CBRE Inc., it quickly became clear that major healthcare organizations around the world oftentimes employ a similar FCI based approach to their capital planning and prioritization decisions.
FACILITY CONDITION INDEX BREAKDOWN
According to a well-known scale developed initially for educational facilities in 1991, a facility is considered in poor condition if its FCI exceeds 90%. The shortcomings of the FCI approach are well-known, as results are not easily compared with alternative condition assessment approaches, and it does not contemplate methodologies for determining replacement values. These choices can become highly political for an organization that uses, as many do, the FCI as a key policy metric.
The basic concern of the laboratory facility managers was that the FCI did not represent the true condition of the facility in terms of safety, security, mission relevance, and other criteria that actually guide their decisions. FCI is also not a forecast or leading indicator that demonstrates consequences of alternative actions. These concerns led to a series of small projects that would eventually define a new approach to summarizing facility condition and prioritizing capital expenditures.
The new method, Risk Scanning, meets three requirements identified in our original meeting. The process must not rely on expensive inspections, must incorporate multiple (customizable) criteria, and the outcomes must be expressed as a simple monetary value.
This approach has universal applicability for laboratories and for large, corporate occupiers. In addition, we have found this approach to be particularly relevant for healthcare organizations today, given the extraordinary economic and regulatory pressures that have become a reality for the industry.
RISK SCANNING
Risk Scanning assumes that buildings or other assets can be reduced to an inventory of components (roof, HVAC equipment, plumbing fixtures, etc.). Each component has a “survivor” curve that relates its age to the likelihood of its failure in the future, little different than an actuarial calculation for an insurance policy. And each component, should it fail, could have consequences for the building operation. Below, Figure 1 illustrates how this data could be used as a simple sort by probability of failure, consequence of failure, or replacement cost.
Figure 1
A more useful view of this data combines knowledge of the probability of failure and the potential consequences as the Risk Facility Managers implicitly consider when scheduling repairs. For example, a new light bulb in a closet would be low risk (low likelihood of failure, low impact on safety, security, mission, etc.), while a roof or electrical panel, far beyond their expected service life would be a high risk. Individual component risk ratings can be aggregated into risk maps by building, consequence type, or aggregated at the portfolio level.
Another example is a risk scan of a data center built in 1980, as shown in Figure 2. Risk is summarized by three consequences or threats of failure – mission, productivity and safety. The “Loss Intensity” is the measure (low, medium, high) of the impact of failure. Each cell in the tables is the sum of the replacement value of each component. For instance, in the first table there are high risk (red) components with replacement values totaling $374,210.
Figure 2: Dashboard showing risk by consequence
One way to represent overall risk is to sum across the individual tables in Figure 2, by risk category (red = high, yellow = moderate, green = low) to produce a single risk column, as shown in Figure 3. This shows that the costs to replace components rated high risk in 2015 for any reason (mission, productivity, or safety) were $2,349,315. Note that some components are high risk for multiple reasons.
Figure 3: Risk Column
The calculation of the column can be modified for different purposes. The ratings from the dashboard could be weighted to reflect management priorities. The likelihood of failure, and consequent migration of risk ratings, could be estimated for a range of years, as shown for the period 2015-2019.
COMPARING THE FCI WITH RISK SCANNING
The data center example provides a useful comparison of the output from a simple condition assessment with the additional data provided by Risk Scanning.
A conventional facility condition assessment using a life cycle cost model indicated that 75 components had exceeded their service life. The costs of replacing these would be $4,771,159. Considering this amount to be deferred maintenance (D.M.), the FCI would be 5% (given $100 million replacement value). This would be summarized as a building in “fair” condition.
Figure 4
A Risk Scan of the component inventory indicates that 13 components are at high risk, and the costs of replacing these would be $2,349,315. This is less than half the costs of replacements by a simple service life-assessment. An FCI based on high risk components would be 2.2%, indicating a building in “good” condition.
In this case, with the additional information provided by Risk Scanning, the facility would be considered in better condition than with the simple condition assessment. Moreover, the risk scan would provide a rating for all components—including those not yet considered as deferred maintenance—as a basis for anticipating future needs and prioritization.
CONCLUSION
The Risk Scanning approach uses well-known risk analytics applied to pre-existing facility data to provide a richer view of facility condition more consistent with actual management decision making. In practice, limited funding is directed to those repairs and replacements that address corporate priorities, such as safety, security, and mission achievement. For healthcare systems, this approach can provide critical insight for decision-making about capital deployment where actionable criteria are not established or where data is limited.
About the Authors
Peter Lufkin is Senior Managing Director and Luca Romani is Senior Analyst with CBRE Whitestone.
Related Stories
 is pleased to announce the acquisition of architecture and interior design firm Binkley Garcia Architecture in Nashville.")
Architects | Feb 15, 2022
Binkley Garcia Architecture and Goodwyn Mills Cawood join forces in Nashville
Goodwyn Mills Cawood (GMC) is pleased to announce the acquisition of architecture and interior design firm Binkley Garcia Architecture in Nashville.

Resiliency | Feb 15, 2022
Design strategies for resilient buildings
LEO A DALY's National Director of Engineering Kim Cowman takes a building-level look at resilient design.

Products and Materials | Feb 14, 2022
How building owners and developers can get ahead of the next supply chain disaster
Global supply chain interruptions that started at the very beginning of the pandemic are still with us and compounding every step of the way. Below are a few proven tips on how to avert some of the costly fallout should we be faced with similar commercial disasters at any time in the future.

Urban Planning | Feb 14, 2022
5 steps to remake suburbs into green communities where people want to live, work, and play
Stantec's John Bachmann offers proven tactic for retrofitting communities for success in the post-COVID era.

Urban Planning | Feb 11, 2022
6 ways to breathe life into mixed-use spaces
To activate mixed-use spaces and realize their fullest potential, project teams should aim to create a sense of community and pay homage to the local history.

Senior Living Design | Feb 11, 2022
Design for senior living: A chat with Rocky Berg, AIA
Rob Cassidy, Editor of MULTIFAMILY Design + Construction, chats with Rocky Berg, AIA, Principal with Dallas architecture firm three, about how to design senior living communities to meet the needs of the owner, seniors, their families, and staff.
Architects | Feb 11, 2022
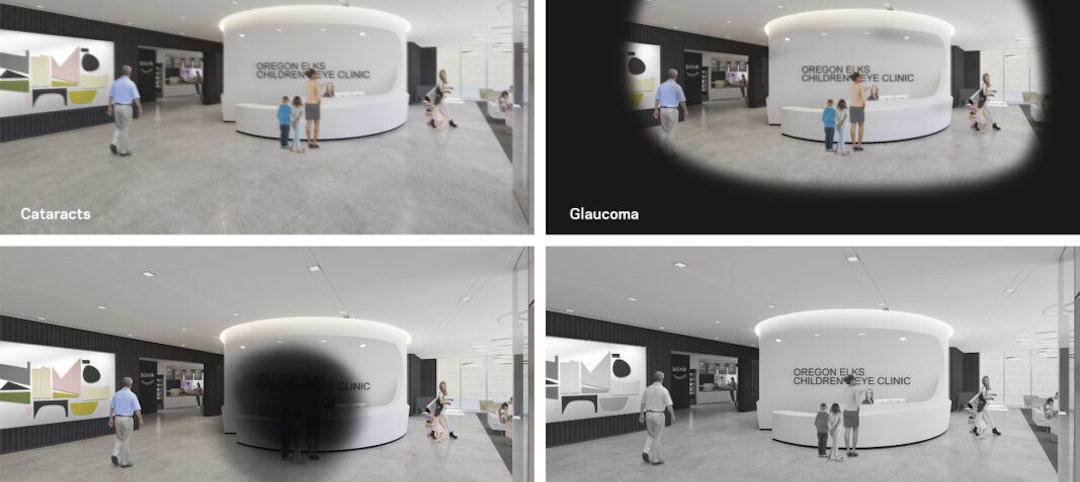
How computer simulations of vision loss create more empathetic buildings for the visually impaired
Here is a look at four challenges identified from our research and how the design responds accordingly.

Healthcare Facilities | Feb 10, 2022
Respite for the weary healthcare worker
The pandemic has shined a light on the severe occupational stress facing healthcare workers. Creating restorative hospital environments can ease their feelings of anxiety and burnout while improving their ability to care for patients.

Architects | Feb 8, 2022
Perkins Eastman and BLT Architects merge
Expanding services in hospitality, education, and mixed-use sectors to better serve clients.

Architects | Feb 3, 2022
SmithGroup elevates Mark Adams to lead workplace practice
In his new role, Adams leads the firm’s practice devoted to the design of corporate and commercial facilities.


