


The Building Owners and Managers Association (BOMA) International has identified the most expensive commercial real estate markets in the U.S. The data is drawn from the 2011 Experience Exchange Report (EER), which provides an annual analysis of the office building operating income and expense data compiled across approximately 940 million square feet of commercial office space in more than 6,500 buildings in 278 different markets. The 2011 report is based on operating income and expenses from 2010.
The most expensive U.S. cities, based on total rental income, include:
- New York, N.Y., $48.27 per square foot (psf)
- Washington, D.C., $42.63 psf
- San Mateo, Calif., $41.61 psf
- Santa Monica, Calif., $36.67 psf
- San Francisco, Calif., $34.86 psf
- Boston, Mass., $31.15 psf
- San Jose, Calif., $30.35 psf
- Los Angeles, Calif., $27.97 psf
- West Palm Beach, Fla., $27.71 psf
- Chicago, Ill., $25.20 psf
Total rental income includes rental income from office, retail, and other space, which includes storage areas. Amid the economic downturn in real estate markets, few markets demonstrated significant increases in rental income, suggesting that rental rates remain relatively stable and favorable for tenants seeking to pursue new leases or renegotiate existing ones. Among the most expensive cities, only New York and San Francisco showed increases in rental income.
Gauging most expensive cities on the basis of total operating and fixed expenses produces a slightly different list:
- New York, N.Y., $21.44 psf
- Washington, D.C., $16.86 psf
- Boston, Mass., $15.16 psf
- Morristown, N.J., $14.67 psf
- San Francisco, Calif., $14.43 psf
- Miami, Fla., $12.87 psf
- Santa Monica, Calif., $12.84 psf
- Plainfield, N.J., $12.83 psf
- Chicago, Ill. and Los Angeles, Calif., 12.49 psf
- Newark, N.J., $12.46 psf
Total operating expenses includes all expenses incurred to operate office buildings, including utilities, repairs/maintenance, cleaning, administrative, security and roads and grounds. Fixed expenses include real estate taxes, property taxes and insurance. In New York, average total operating plus fixed expenses were $21.44 per square foot (psf), while in Los Angeles, they averaged $12.96 psf. Operating expenses increased in most markets in the last year. Fixed expenses were volatile, which could be attributed in part to rising utility costs as well as rising real estate taxes. While many cash-constrained cities and municipalities are looking to real estate for tax revenue, many property owners are contesting tax assessments because asset values have decreased due to the economic downturn. BD+C
Related Stories
| Feb 14, 2014
ASHRAE, Green Grid team up on energy-efficiency guide for data centers
Vendor-neutral publication examines aspects of the popular power usage effectiveness (PUE) metric.
 with")
| Feb 14, 2014
Scrap tires used to boost masonry blocks at Missouri University of S&T
Research could lead to blocks that use waste material and have seismic and insulating benefits.

| Feb 14, 2014
Giant interactive pinwheel adds fun to museum exterior
The proposed design for the Santa Cruz Museum of Art and History features a 10-foot pinwheel that can be activated by passersby.

| Feb 14, 2014
First look: Kentucky's Rupp Arena to get re-clad as part of $310M makeover
Rupp Arena will get a 40-foot high glass façade and a new concourse, but will retain many of its iconic design elements.
| Feb 14, 2014
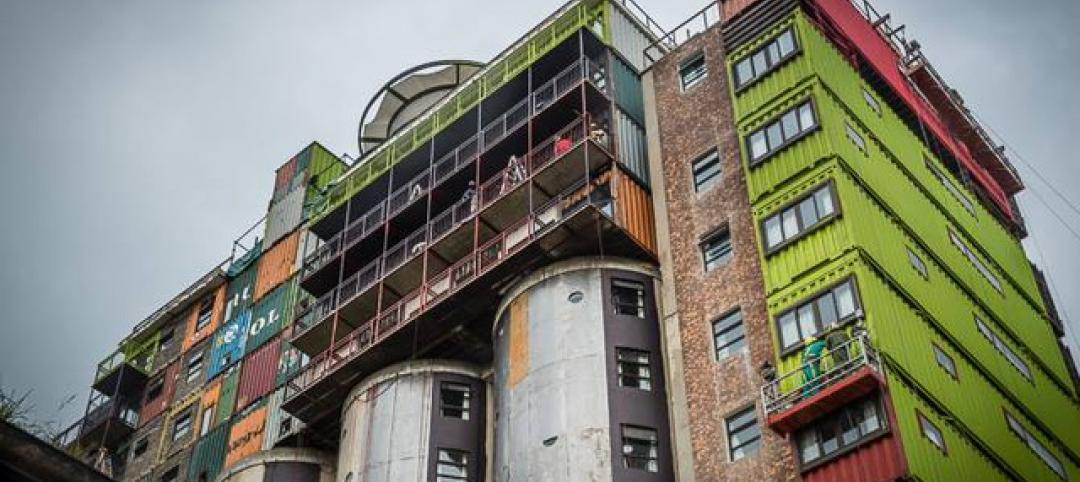
Must see: Developer stacks shipping containers atop grain silos to create student housing tower
Mill Junction will house up to 370 students and is supported by 50-year-old grain silos.

| Feb 14, 2014
The Technology Report 2014: Top tech tools and trends for AEC professionals
In this special five-part report, Building Design+Construction explores how Building Teams throughout the world are utilizing advanced robotics, 3D printers, drones, data-driven design, and breakthroughs in building information modeling to gain efficiencies and create better buildings.
| Feb 14, 2014
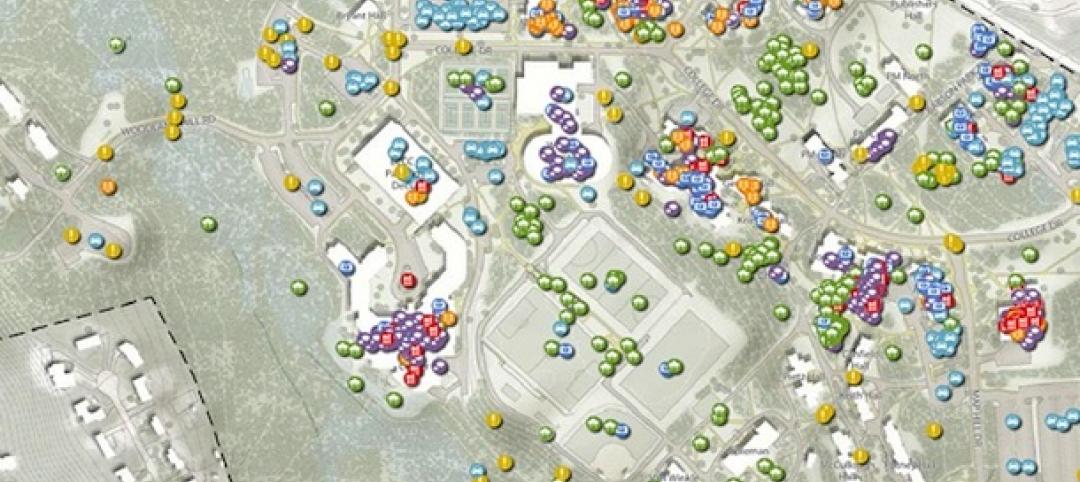
Crowdsourced Placemaking: How people will help shape architecture
The rise of mobile devices and social media, coupled with the use of advanced survey tools and interactive mapping apps, has created a powerful conduit through which Building Teams can capture real-time data on the public. For the first time, the masses can have a real say in how the built environment around them is formed—that is, if Building Teams are willing to listen.

| Feb 13, 2014
University officials sound off on net zero energy buildings
As part of its ongoing ZNE buildings research project, Sasaki Associates, in collaboration with Buro Happold, surveyed some 500 campus designers and representatives on the top challenges and opportunities for achieving net-zero energy performance on university and college campuses.

| Feb 13, 2014
3 keys to designing freestanding emergency departments
Having physically disassociated from a central hospital, FEDs must overcome the particular challenges associated with a satellite location, namely a lack of awareness, appeal, and credibility. Gresham, Smith & Partners' Kristin Herman-Druc offers three keys to success.
| Feb 13, 2014
Why you should start with a builder
They say the best way to eat an elephant is one bite at a time. Expanding your building or constructing a new structure for your business, church, or school isn’t all that different. Attacking it is best done in small, deliberate pieces.


