


The Building Owners and Managers Association (BOMA) International has identified the most expensive commercial real estate markets in the U.S. The data is drawn from the 2011 Experience Exchange Report (EER), which provides an annual analysis of the office building operating income and expense data compiled across approximately 940 million square feet of commercial office space in more than 6,500 buildings in 278 different markets. The 2011 report is based on operating income and expenses from 2010.
The most expensive U.S. cities, based on total rental income, include:
- New York, N.Y., $48.27 per square foot (psf)
- Washington, D.C., $42.63 psf
- San Mateo, Calif., $41.61 psf
- Santa Monica, Calif., $36.67 psf
- San Francisco, Calif., $34.86 psf
- Boston, Mass., $31.15 psf
- San Jose, Calif., $30.35 psf
- Los Angeles, Calif., $27.97 psf
- West Palm Beach, Fla., $27.71 psf
- Chicago, Ill., $25.20 psf
Total rental income includes rental income from office, retail, and other space, which includes storage areas. Amid the economic downturn in real estate markets, few markets demonstrated significant increases in rental income, suggesting that rental rates remain relatively stable and favorable for tenants seeking to pursue new leases or renegotiate existing ones. Among the most expensive cities, only New York and San Francisco showed increases in rental income.
Gauging most expensive cities on the basis of total operating and fixed expenses produces a slightly different list:
- New York, N.Y., $21.44 psf
- Washington, D.C., $16.86 psf
- Boston, Mass., $15.16 psf
- Morristown, N.J., $14.67 psf
- San Francisco, Calif., $14.43 psf
- Miami, Fla., $12.87 psf
- Santa Monica, Calif., $12.84 psf
- Plainfield, N.J., $12.83 psf
- Chicago, Ill. and Los Angeles, Calif., 12.49 psf
- Newark, N.J., $12.46 psf
Total operating expenses includes all expenses incurred to operate office buildings, including utilities, repairs/maintenance, cleaning, administrative, security and roads and grounds. Fixed expenses include real estate taxes, property taxes and insurance. In New York, average total operating plus fixed expenses were $21.44 per square foot (psf), while in Los Angeles, they averaged $12.96 psf. Operating expenses increased in most markets in the last year. Fixed expenses were volatile, which could be attributed in part to rising utility costs as well as rising real estate taxes. While many cash-constrained cities and municipalities are looking to real estate for tax revenue, many property owners are contesting tax assessments because asset values have decreased due to the economic downturn. BD+C
Related Stories

| May 8, 2014
Don’t bother planning for the future - it doesn’t care about you
Though strategic planning has helped many businesses move forward, its time has passed. So says Economist and Author Bill Conerly. SPONSORED CONTENT
| May 8, 2014
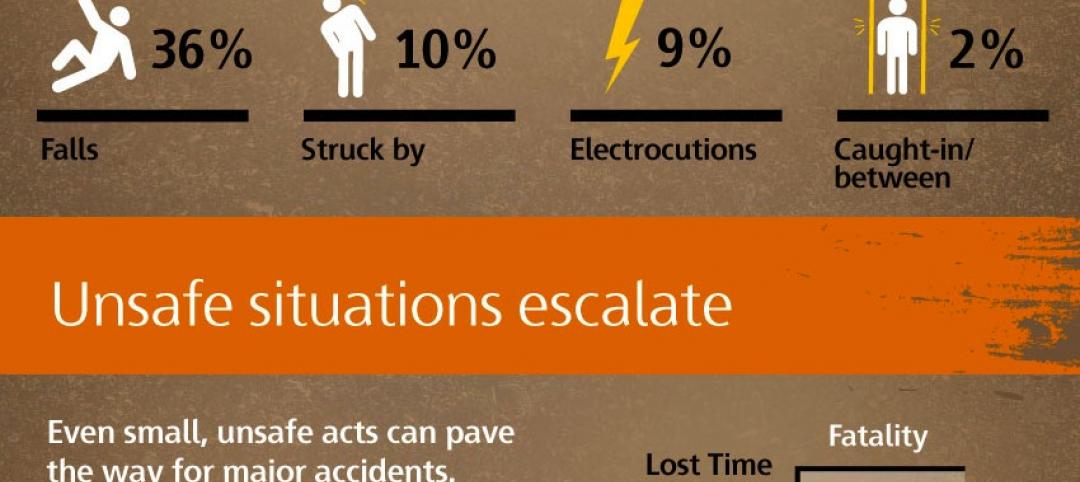
Infographic: 4 most common causes of construction site fatalities
In honor of Safety Week, Skanska put together this nifty infographic on how to prevent deadly harm in construction.

| May 8, 2014
Sporting events in style: Infographic showcases novel stadiums of the world
UK precast concrete maker Banagher, which specializes in precast stadia solutions, has assembled a list of the world's top stadiums in terms of architectural and structural design.

| May 7, 2014
Design competition: $900,000 on the line in Las Vegas revitalization challenge
Las Vegas Mayor Carolyn Goodman wants your economic development ideas for remaking four areas within the city, including the Cashman Center and the Las Vegas Medical District.

| May 6, 2014
'Beyond' is artist's cinematic take on 2.5 years of development in the UAE
Seven-minute video offers a time-lapse trip through the built environments of Abu Dhabi and Dubai.

| May 6, 2014
'Ugliest building in New Jersey' finally getting facelift
After a decade of false starts and mishaps, the American Dream mall in the Meadowlands may finally get built.

| May 5, 2014
Toronto residential tower to feature drawer-like facade scheme
Some of the apartments in the new River City development will protrude from the building at different lengths, creating a drawer-like "push-pull" effect.
| May 5, 2014
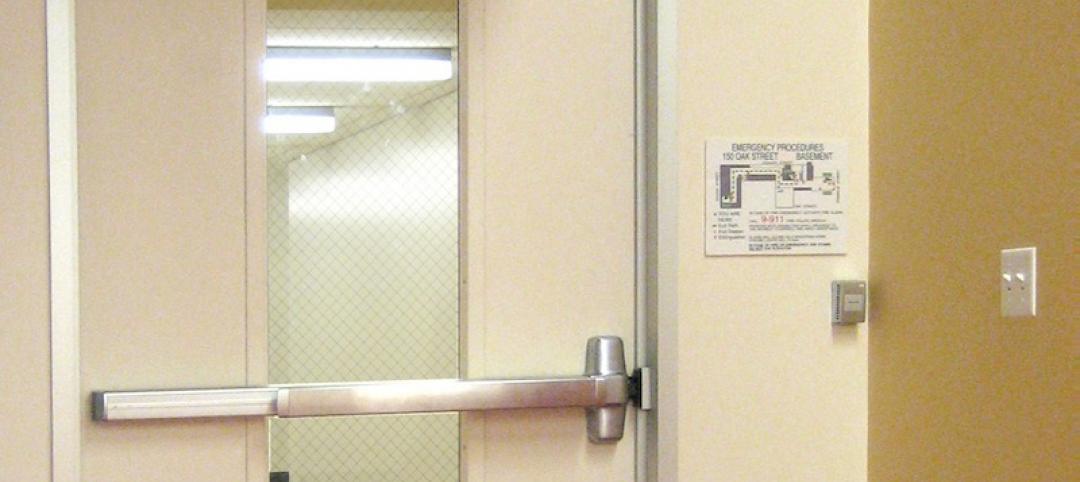
Tragic wired glass injury makes headlines yet again
In the story, a high school student pushed open a hallway door glazed with wired glass. His arm not only broke the glass, but penetrated it, causing severe injuries. SPONSORED CONTENT

| May 3, 2014
Health system capital planning for the future: The benefits of master plan portfolio analysis and ambulatory market modeling
Money continues to be scarce, yet U.S. health systems need to invest and re-invest in their physical future. Healthcare facilities planning experts from CBRE Healthcare outline tools and strategies for identifying where to best allocate precious resources.


