


The Building Owners and Managers Association (BOMA) International has identified the most expensive commercial real estate markets in the U.S. The data is drawn from the 2011 Experience Exchange Report (EER), which provides an annual analysis of the office building operating income and expense data compiled across approximately 940 million square feet of commercial office space in more than 6,500 buildings in 278 different markets. The 2011 report is based on operating income and expenses from 2010.
The most expensive U.S. cities, based on total rental income, include:
- New York, N.Y., $48.27 per square foot (psf)
- Washington, D.C., $42.63 psf
- San Mateo, Calif., $41.61 psf
- Santa Monica, Calif., $36.67 psf
- San Francisco, Calif., $34.86 psf
- Boston, Mass., $31.15 psf
- San Jose, Calif., $30.35 psf
- Los Angeles, Calif., $27.97 psf
- West Palm Beach, Fla., $27.71 psf
- Chicago, Ill., $25.20 psf
Total rental income includes rental income from office, retail, and other space, which includes storage areas. Amid the economic downturn in real estate markets, few markets demonstrated significant increases in rental income, suggesting that rental rates remain relatively stable and favorable for tenants seeking to pursue new leases or renegotiate existing ones. Among the most expensive cities, only New York and San Francisco showed increases in rental income.
Gauging most expensive cities on the basis of total operating and fixed expenses produces a slightly different list:
- New York, N.Y., $21.44 psf
- Washington, D.C., $16.86 psf
- Boston, Mass., $15.16 psf
- Morristown, N.J., $14.67 psf
- San Francisco, Calif., $14.43 psf
- Miami, Fla., $12.87 psf
- Santa Monica, Calif., $12.84 psf
- Plainfield, N.J., $12.83 psf
- Chicago, Ill. and Los Angeles, Calif., 12.49 psf
- Newark, N.J., $12.46 psf
Total operating expenses includes all expenses incurred to operate office buildings, including utilities, repairs/maintenance, cleaning, administrative, security and roads and grounds. Fixed expenses include real estate taxes, property taxes and insurance. In New York, average total operating plus fixed expenses were $21.44 per square foot (psf), while in Los Angeles, they averaged $12.96 psf. Operating expenses increased in most markets in the last year. Fixed expenses were volatile, which could be attributed in part to rising utility costs as well as rising real estate taxes. While many cash-constrained cities and municipalities are looking to real estate for tax revenue, many property owners are contesting tax assessments because asset values have decreased due to the economic downturn. BD+C
Related Stories

Multifamily Housing | Jan 31, 2015
Production builders are still shying away from rental housing
Toll Brothers, Lennar, and Trumark are among a small group of production builders to engage in construction for rental customers.

Architects | Jan 30, 2015
Exhibit captures 60 of Bjarke Ingels' projects — from hottest to coldest places on Earth
The Hot to Cold exhibit encompasses 60 of BIG’s recent projects captured by Iwan Baan´s masterful photography.

BIM and Information Technology | Jan 29, 2015
Lego X by Gravity elevates the toy to a digital modeling kit
With the Lego X system, users can transfer the forms they’ve created with legos into real-time digital files.

Energy Efficiency | Jan 28, 2015
An urban wind and solar energy system that may actually work
The system was designed to take advantage of a building's air flow and generate energy even if its in the middle of a city.
Multifamily Housing | Jan 27, 2015
Multifamily construction, focused on rentals, expected to slow in the coming years
New-home purchases, which recovered strongly in 2014, indicate that homeownership might finally be making a comeback.

Office Buildings | Jan 27, 2015
London plans to build Foggo Associates' 'can of ham' building
The much delayed high-rise development at London’s 60-70 St. Mary Axe resembles a can of ham, and the project's architects are embracing the playful sobriquet.

Multifamily Housing | Jan 22, 2015
Sales of apartment buildings hit record high in 2014
Investors bet big time on demand for rental properties over homeownership in 2014, when sales of apartment buildings hit a record $110.1 billion, or nearly 15% higher than the previous year.

| Jan 22, 2015
Architecture Billings Index rebounds at end of 2014
The American Institute of Architects reported the December ABI score was 52.2, up from a mark of 50.9 in November. This score reflects an increase in design activity.

| Jan 21, 2015
From technician to rainmaker: Making the leap in your career
Many AEC firms focus on training for the hard skills of the profession, not so much for business prowess, writes BD+C's David Barista.
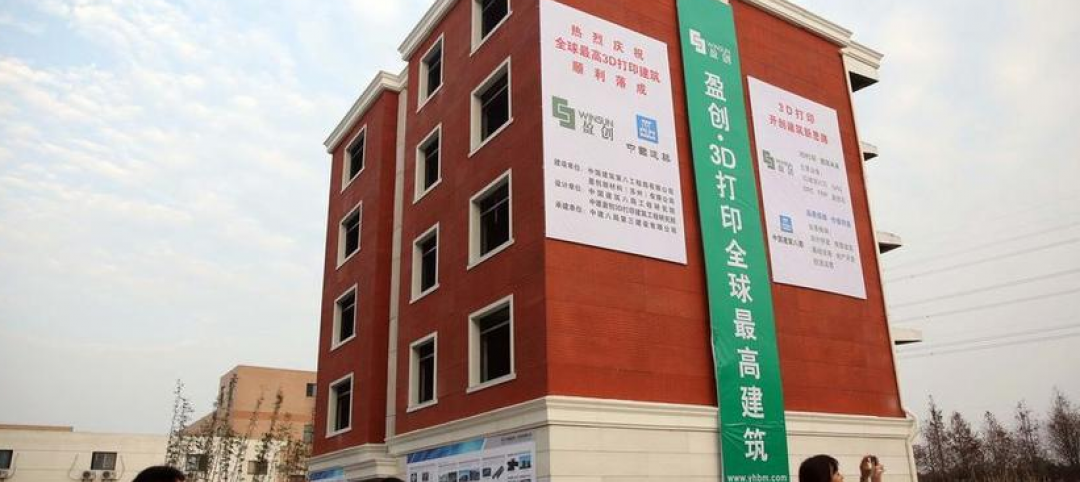
Modular Building | Jan 21, 2015
Chinese company 3D prints six-story multifamily building
The building components were prefabricated piece by piece using a printer that is 7 meters tall, 10 meters wide, and 40 meters long.


