


The Building Owners and Managers Association (BOMA) International has identified the most expensive commercial real estate markets in the U.S. The data is drawn from the 2011 Experience Exchange Report (EER), which provides an annual analysis of the office building operating income and expense data compiled across approximately 940 million square feet of commercial office space in more than 6,500 buildings in 278 different markets. The 2011 report is based on operating income and expenses from 2010.
The most expensive U.S. cities, based on total rental income, include:
- New York, N.Y., $48.27 per square foot (psf)
- Washington, D.C., $42.63 psf
- San Mateo, Calif., $41.61 psf
- Santa Monica, Calif., $36.67 psf
- San Francisco, Calif., $34.86 psf
- Boston, Mass., $31.15 psf
- San Jose, Calif., $30.35 psf
- Los Angeles, Calif., $27.97 psf
- West Palm Beach, Fla., $27.71 psf
- Chicago, Ill., $25.20 psf
Total rental income includes rental income from office, retail, and other space, which includes storage areas. Amid the economic downturn in real estate markets, few markets demonstrated significant increases in rental income, suggesting that rental rates remain relatively stable and favorable for tenants seeking to pursue new leases or renegotiate existing ones. Among the most expensive cities, only New York and San Francisco showed increases in rental income.
Gauging most expensive cities on the basis of total operating and fixed expenses produces a slightly different list:
- New York, N.Y., $21.44 psf
- Washington, D.C., $16.86 psf
- Boston, Mass., $15.16 psf
- Morristown, N.J., $14.67 psf
- San Francisco, Calif., $14.43 psf
- Miami, Fla., $12.87 psf
- Santa Monica, Calif., $12.84 psf
- Plainfield, N.J., $12.83 psf
- Chicago, Ill. and Los Angeles, Calif., 12.49 psf
- Newark, N.J., $12.46 psf
Total operating expenses includes all expenses incurred to operate office buildings, including utilities, repairs/maintenance, cleaning, administrative, security and roads and grounds. Fixed expenses include real estate taxes, property taxes and insurance. In New York, average total operating plus fixed expenses were $21.44 per square foot (psf), while in Los Angeles, they averaged $12.96 psf. Operating expenses increased in most markets in the last year. Fixed expenses were volatile, which could be attributed in part to rising utility costs as well as rising real estate taxes. While many cash-constrained cities and municipalities are looking to real estate for tax revenue, many property owners are contesting tax assessments because asset values have decreased due to the economic downturn. BD+C
Related Stories

University Buildings | Aug 16, 2016
New images of Rice University’s Moody Center for the Arts revealed by Michael Maltzan Architecture
The arts center will foster creativity for making and presenting works across all disciplines

Designers | Aug 16, 2016
CCDI, Morphosis, and Diller Scofidio + Renfro are among ten finalists vying for Chinese Eco-Island design
The winning firm will design the master plan and central buildings for the man made Haikou Bay island.

Mixed-Use | Aug 16, 2016
Goettsch Partners completes mixed-use tower in R&F Yingkai Square
The 66-story building is now the 7th tallest completed building in Guangzhou.
| Aug 15, 2016
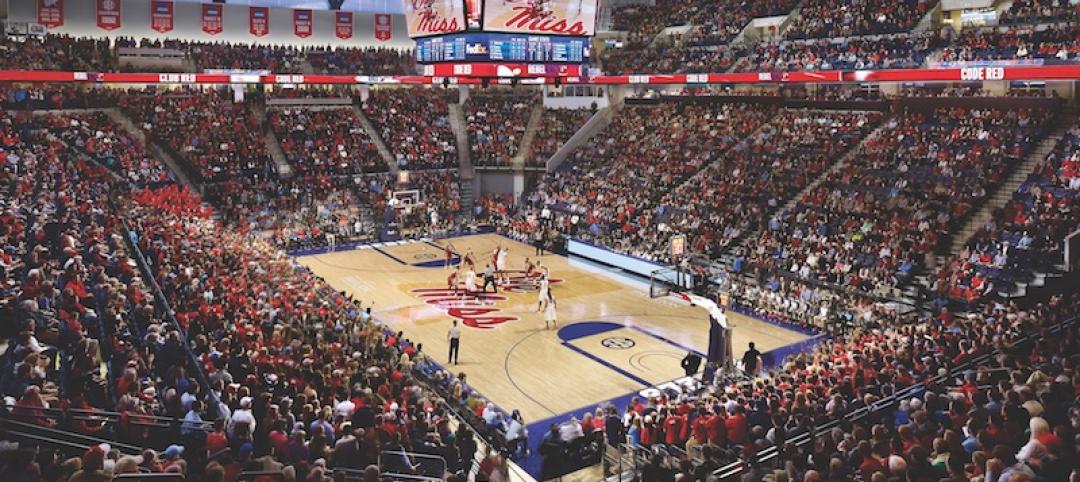
SPORTS FACILITY GIANTS: New and renovated college sports venues - designed to serve students and the community
Schools are renovating existing structures or building new sports facilities that can serve the student body and surrounding community.

| Aug 15, 2016
Top 50 Sports Facility Architecture Firms
Populous, HKS, and HOK top Building Design+Construction’s annual ranking of the nation’s largest sports facility sector architecture and A/E firms, as reported in the 2016 Giants 300 Report.
| Aug 15, 2016
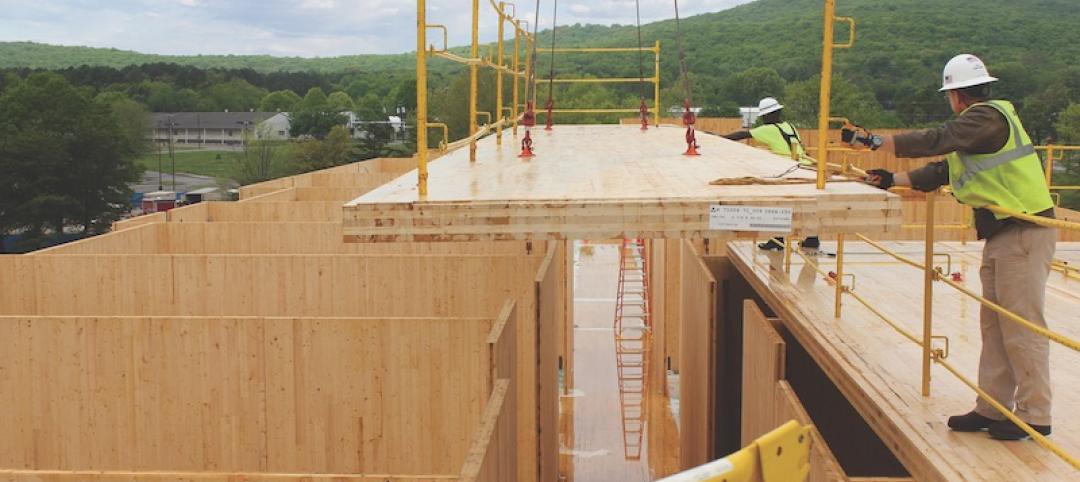
MILITARY GIANTS: Cross-laminated timber construction gets a salute from the Army
By privatizing the construction, renovation, operation, maintenance, and ownership of its hotels the Army expects to cut a 20-year timetable for repairs and replacement of its lodging down to eight years.
| Aug 15, 2016
Top 30 Military Architecture Firms
HDR, Clark Nexsen, and Guernsey top Building Design+Construction’s annual ranking of the nation’s largest military sector architecture and A/E firms, as reported in the 2016 Giants 300 Report.

| Aug 12, 2016
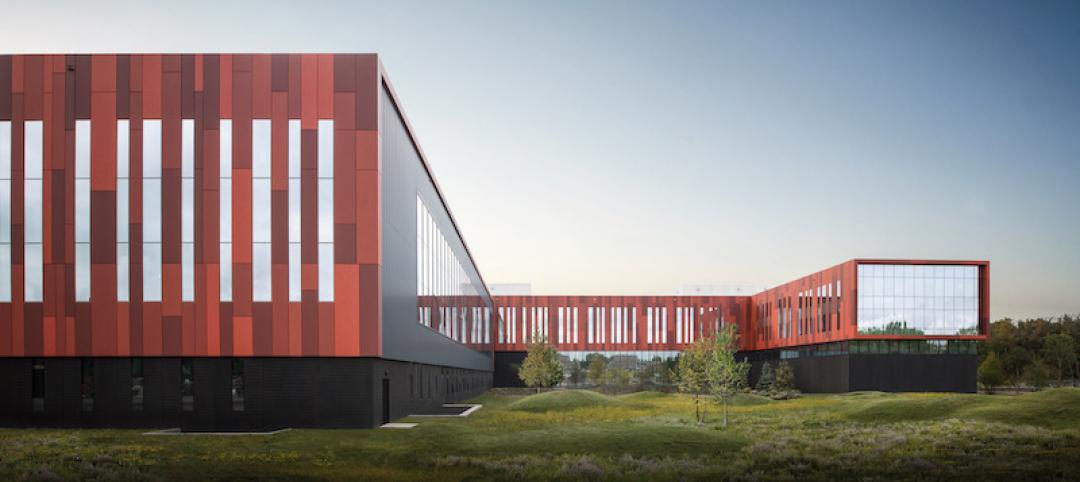
SCIENCE + TECHNOLOGY GIANTS: Incubator model is reimagining research and lab design
Interdisciplinary interaction is a common theme among many new science and technology offices.

| Aug 12, 2016
Top 40 Science + Technology Architecture Firms
Perkins+Will, HDR, and HOK top Building Design+Construction’s annual ranking of the nation’s largest science + technology sector architecture and A/E firms, as reported in the 2016 Giants 300 Report.

| Aug 12, 2016
OFFICE GIANTS: Technology is giving office workers the chance to play musical chairs
Technology is redefining how offices function and is particularly salient in the growing trend of "hoteling" and "hot seating" or "free addressing."


