


During the 10 years between 2006 and 2016, almost a quarter of the 100 largest cities in the United States shifted from owner- to renter-majority. In total, rentership growth outpaced homeownership in 97 of the 100 largest (by population) cities. 22 cities total made the shift, including key markets like Chicago, San Diego, Detroit, Austin, and Sacramento. The addition of these 22 cities now puts the total number of renter-dominated cities at 42, according to RENTCafé.
Gilbert, Ariz., saw the highest increase in renter share at 53.4%. Plano, Texas (40.0%), St. Petersburg, Fla. (39.4%), North Las Vegas, Nev. (38.5%), and Toledo Ohio (31.3%) round out the top five.
Newark, N.J., and Jersey City, N.J. place first and second as the markets with the highest proportion of renters at 74.3% and 70.4% respectively. Miami (68%), New York (65.1%), Boston (63.7%), and Orlando (62.7%) followed the two New Jersey cities.
For the full RENTCafé report, click here.
Related Stories
Market Data | Jul 8, 2020
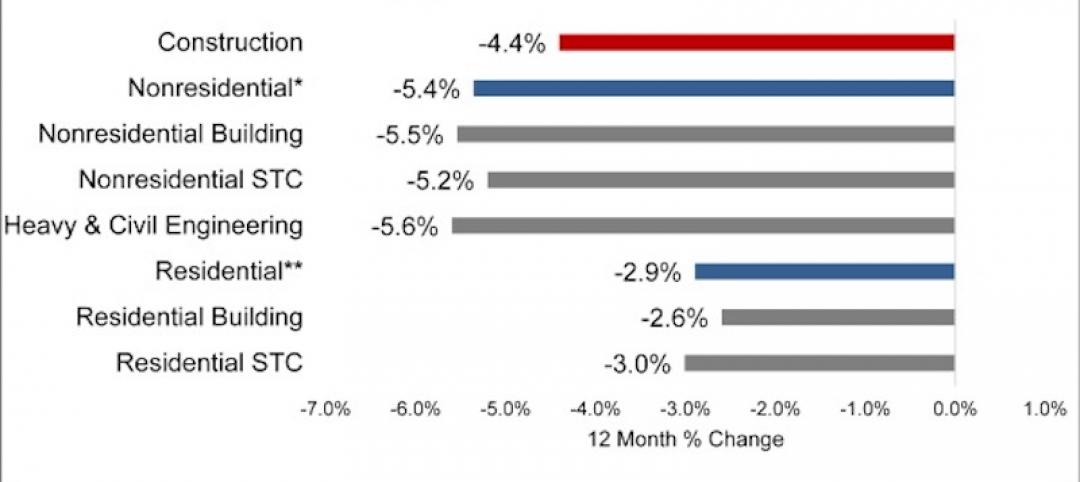
North America’s construction output to fall by 6.5% in 2020, says GlobalData
Even though all construction activities have been allowed to continue in most parts of the US and Canada since the start of the COVID-19 pandemic, many projects in the bidding or final planning stages have been delayed or canceled.
Market Data | Jul 8, 2020
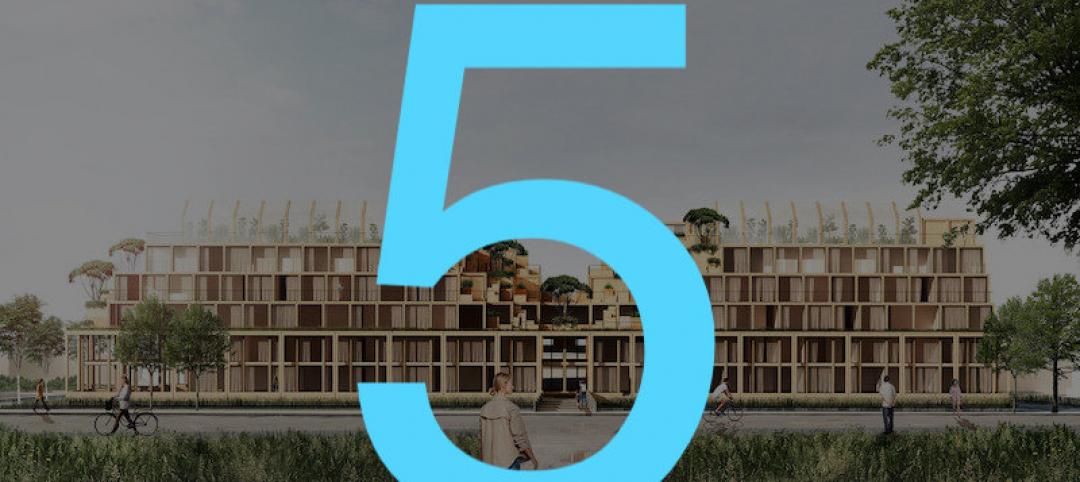
5 must reads for the AEC industry today: July 8, 2020
AEMSEN develops concept for sustainable urban living and nonresidential construction has recovered 56% of jobs lost since March.
Market Data | Jul 7, 2020
Nonresidential construction has recovered 56% of jobs lost since March employment report
Nonresidential construction employment added 74,700 jobs on net in June.

Market Data | Jul 7, 2020
7 must reads for the AEC industry today: July 7, 2020
Construction industry adds 158,000 workers in June and mall owners open micro distribution hubs for e-commerce fulfillment.

Market Data | Jul 6, 2020
Nonresidential construction spending falls modestly in May
Private nonresidential spending declined 2.4% in May and public nonresidential construction spending increased 1.2%.

Market Data | Jul 6, 2020
Construction industry adds 158,000 workers in June but infrastructure jobs decline
Gains in June are concentrated in homebuilding as state and local governments postpone or cancel roads and other projects in face of looming budget deficits.

Market Data | Jul 6, 2020
5 must reads for the AEC industry today: July 6, 2020
Demand growth for mass timber components and office demand has increased as workers return.

Market Data | Jul 2, 2020
Fall in US construction spending in May shows weakness of country’s construction industry, says GlobalData
Dariana Tani, Economist at GlobalData, a leading data and analytics company, offers her view on the situation

Market Data | Jul 2, 2020
6 must reads for the AEC industry today: July 2, 2020
Construction spending declines 2.1% in May and how physical spaces may adapt to a post-COVID world.

Market Data | Jul 1, 2020
Construction spending declines 2.1% in May as drop in private work outweighs public pickup
Federal infrastructure measure can help offset private-sector demand that is likely to remain below pre-coronavirus levels amid economic uncertainty.


