


Since 2008, 13 municipalities have filed for bankruptcy. With Detroit’s bankruptcy trial approaching, and many other cities still struggling to recover from the Great Recession, personal finance social network WalletHub crunched the numbers to identify 2014's Most & Least Recession-Recovered Cities.
To evaluate the progress of local cities in propelling their economic growth, WalletHub compared the 150 largest U.S. cities to identify those that have experienced the most and least improvement since the recession. Using 18 key metrics — from the inflow of college-educated workers and number of new businesses to unemployment rates and home price appreciation — we examined how each city has evolved economically in the past several years. By doing so, WalletHub can help consumers assess how their present financial situations might be affected by the economic health of their cities.
| Most Recession-Recovered Cities | Least Recession-Recovered Cities | ||||
| 1. | Laredo, TX | 141. | Riverside, CA | ||
| 2. | Irving, TX | 142. | Tempe, AZ | ||
| 3. | Fayetteville, NC | 143. | Glendale, AZ | ||
| 4. | Denver, CO | 144. | Tucson, AZ | ||
| 5. | Dallas, TX | 145. | Cape Coral, FL | ||
| 6. | Corpus Christi, TX | 146. | Detroit, MI | ||
| 7. | Minneapolis, MN | 147. | Modesto, CA | ||
| 8. | Lubbock, TX | 148. | Newark, NJ | ||
| 9. | Garland, TX | 149. | Stockton, CA | ||
| 10. | Raleigh, NC | 150. | San Bernardino, CA | ||
Key Stats
- Mobile, Ala., experienced the largest increase in its unemployment rate, at 4%. Toledo, Ohio experienced the largest decrease, at 1%.
- Cape Coral, Fla., experienced the largest increase in its poverty rate, at 8%. El Paso, Texas, experienced the largest decrease, at 5%.
- New Orleans registered the highest home price appreciation, at 64%. Detroit registered the highest home price depreciation, with a loss of 65%.
- Raleigh, N. C. experienced the highest population growth rate, at 21%. Detroit experienced the highest decline, at 16%.
- Orlando, Fla., experienced the largest decrease in its violent crime rate, at 1%. Springfield, Mo., experienced the largest increase, at 0.3%.
- Corpus Christi, Texas, experienced the largest increase in GDP, at 30%. Cape Coral, Fla., experienced the largest decrease, at 6%.
For the full report and to see where your city ranks, please visit:
http://wallethub.com/edu/most-
Related Stories

Multifamily Housing | Jan 4, 2018
Shigeru Ban’s mass timber tower in Vancouver gets city approval
The 232-foot-tall Terrace House luxury condo development will be the tallest hybrid wood structure in North America.
Architects | Jan 4, 2018
Integrated design for children and housing
Homelessness is an issue affecting millions around the globe.

Sponsored | | Jan 3, 2018
4 networking strategies to grow your business
Follow these networking strategies to grow your architectural business with the work that you want.

BD+C University Course | Jan 2, 2018
The art and science of rendering: Visualization that sells architecture [AIA course]
3D artist Ramy Hanna offers guidelines and tricks-of-the-trade to ensure that project artwork is a stunning depiction of the unbuilt space.
Green | Dec 22, 2017
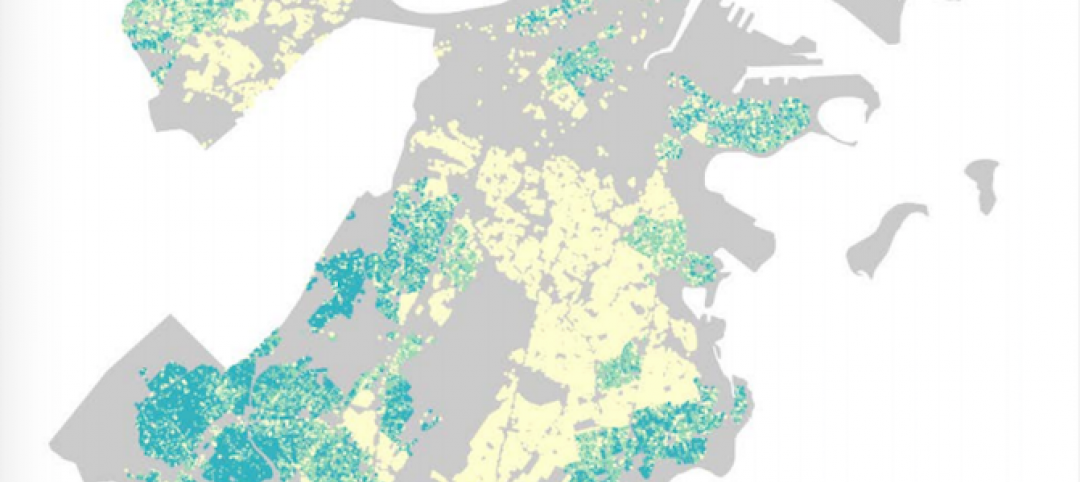
Green builders can use ‘big data’ to make design decisions
More and more, green project teams are relying on publicly available “external datasets” to prioritize sustainable design decisions, says sustainability consultant Adele Houghton.

Reconstruction & Renovation | Dec 21, 2017
Interactive map includes detailed information on historic New York City buildings
The New York City Landmarks Preservation Commission launched a new, enhanced version of its interactive map, Discover NYC Landmarks.

High-rise Construction | Dec 20, 2017
Another record year for high-rise construction
More than 140 skyscrapers were completed across the globe this year, including 15 supertall towers.

Game Changers | Dec 20, 2017
Urban farms can help plant seeds for cities’ growth around them
Urban farms have been impacting cities’ agribusiness—and, on some cases, their redevelopment—for decades.
 reported the November ABI score was 55.0, up from a score of 51.7 in the previous month. Photo: Pixabay")
Market Data | Dec 20, 2017
Architecture billings upturn shows broad strength
The American Institute of Architects (AIA) reported the November ABI score was 55.0, up from a score of 51.7 in the previous month.

Public Health Labs | Dec 19, 2017
10 takeaways from SmithGroup’s ‘lab of the future’ initiative
The LAB2050 initiative digs into the scientific trends, technologies, and economics that will shape tomorrow’s research laboratory environments.


