


Top Transit Facility Sector Architecture Firms
| Rank | Company | 2013 Transit Sector Revenue |
| 1 | Leo A Daly | $19,803,803 |
| 2 | HDR | $8,100,000 |
| 3 | RNL | $7,417,000 |
| 4 | NORR | $7,300,016 |
| 5 | Heery International | $5,041,778 |
| 6 | Perkins+will | $4,800,000 |
| 7 | Perkins Eastman | $4,650,000 |
| 8 | ZGF Architects | $4,202,825 |
| 9 | FXFOWLE Architects | $3,600,000 |
| 10 | Epstein | $3,064,000 |
| 11 | HOK | $2,934,633 |
| 12 | LMN Architects | $2,277,300 |
| 13 | Gensler | $2,177,922 |
| 14 | Stantec | $1,705,602 |
| 15 | Solomon Cordwell Buenz | $1,700,000 |
| 16 | IBI Group ? Gruzen Samton | $1,500,000 |
| 17 | Cooper Carry | $1,490,792 |
| 18 | Legat Architects | $1,458,600 |
| 19 | Beyer Blinder Belle | $1,123,611 |
| 20 | Ratio Architects | $862,924 |
| 21 | Wight & Company | $525,000 |
| 22 | Kohn Pedersen Fox Associates | $461,700 |
| 23 | Niles Bolton Associates | $458,200 |
| 24 | BLTa | $393,000 |
| 25 | Becker Morgan Group | $350,869 |
| 26 | Hoffmann Architects | $310,000 |
| 27 | Lord Aeck Sargent | $282,129 |
| 28 | NAC|Architecture | $267,646 |
| 29 | HNTB Corp. | $162,805 |
| 30 | Symmes Maini & McKee Associates | $70,000 |
| 31 | CTA Architects Engineers | $21,997 |
| 32 | TEG Architects | $15,000 |
Top Transit Facility Sector Engineering Firms
| Rank | Company | 2013 Transit Sector Revenue |
| 1 | URS Corp. | $80,426,891 |
| 2 | AECOM Technology Corp. | $73,630,000 |
| 3 | Parsons Brinckerhoff | $63,647,346 |
| 4 | Jacobs | $59,000,000 |
| 5 | Arup | $30,762,561 |
| 6 | STV | $29,294,000 |
| 7 | KPFF Consulting Engineers | $5,500,000 |
| 8 | Thornton Tomasetti | $4,745,871 |
| 9 | Ross & Baruzzini | $4,443,353 |
| 10 | Simpson Gumpertz & Heger | $4,230,000 |
| 11 | Leidos | $2,540,000 |
| 12 | TLC Engineering for Architecture | $1,948,605 |
| 13 | WSP Group | $1,930,000 |
| 14 | Coffman Engineers | $1,439,383 |
| 15 | Glumac | $726,059 |
| 16 | Dewberry | $650,000 |
| 17 | Fishbeck, Thompson, Carr & Huber | $600,000 |
| 18 | Brinjac Engineering | $579,114 |
| 19 | AKF Group | $547,000 |
| 20 | Aon Fire Protection Engineering Corp. | $500,000 |
| 21 | Wiss, Janney, Elstner Associates | $470,000 |
| 22 | BR+A Consulting Engineers | $460,000 |
| 23 | Paulus, Sokolowski and Sartor | $330,000 |
| 24 | M-E Engineers | $250,000 |
| 25 | Martin/Martin | $228,163 |
| 26 | Highland Associates | $200,000 |
| 27 | Spectrum Engineers | $142,474 |
| 28 | Dunham Associates | $125,000 |
| 29 | Environmental Systems Design | $124,172 |
| 30 | Guernsey | $123,196 |
| 31 | CJL Engineering | $105,050 |
| 32 | Allen & Shariff | $100,000 |
| 33 | Bridgers & Paxton Consulting Engineers | $84,347 |
| 34 | Interface Engineering | $49,000 |
| 35 | Apogee Consulting Group | $13,200 |
| 36 | P2S Engineering | $11,368 |
| 37 | Karpinski Engineering | $10,480 |
| 38 | Henderson Engineers | $8,777 |
| 39 | Newcomb & Boyd | $8,537 |
Top Transit Facility Sector Construction Firms
| Rank | Company | 2013 Transit Sector Revenue |
| 1 | Skanska USA | $428,852,738 |
| 2 | Walsh Group, The | $230,787,366 |
| 3 | Clark Group | $186,244,504 |
| 4 | Turner Construction | $158,400,000 |
| 5 | Tutor Perini Corp. | $125,550,873 |
| 6 | Parsons Brinckerhoff | $63,647,346 |
| 7 | Hoffman Construction | $61,000,000 |
| 8 | Whiting-Turner Contracting Co., The | $56,441,628 |
| 9 | Bernards | $44,000,000 |
| 10 | STV | $29,294,000 |
| 11 | LPCiminelli | $25,006,749 |
| 12 | McCarthy Holdings | $19,250,000 |
| 13 | Hill International | $17,000,000 |
| 14 | Suffolk Construction | $16,487,695 |
| 15 | Adolfson & Peterson Construction | $15,201,393 |
| 16 | Bomel Construction | $7,064,099 |
| 17 | Gilbane | $6,840,400 |
| 18 | Absher Construction | $6,107,896 |
| 19 | Heery International | $5,041,778 |
| 20 | Coakley & Williams Construction | $2,803,663 |
| 21 | Ryan Companies US | $609,623 |
| 22 | Wight & Company | $188,000 |
| 23 | Astorino | $163,558 |
| 24 | Allen & Shariff | $100,000 |
| 25 | W. M. Jordan Company | $70,840 |
Read BD+C's full 2014 Giants 300 Report
Related Stories

Sponsored | | Jan 3, 2018
4 networking strategies to grow your business
Follow these networking strategies to grow your architectural business with the work that you want.

BD+C University Course | Jan 2, 2018
The art and science of rendering: Visualization that sells architecture [AIA course]
3D artist Ramy Hanna offers guidelines and tricks-of-the-trade to ensure that project artwork is a stunning depiction of the unbuilt space.
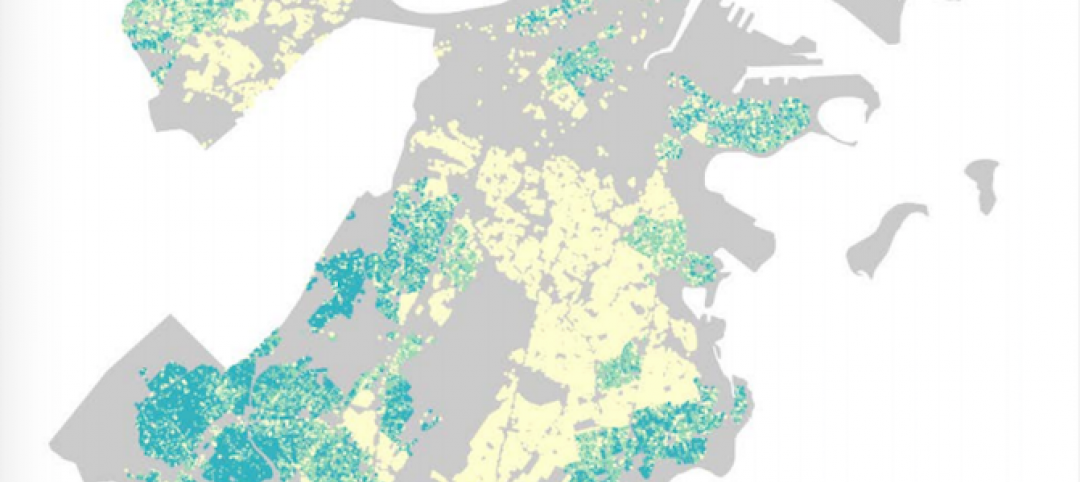
Green | Dec 22, 2017
Green builders can use ‘big data’ to make design decisions
More and more, green project teams are relying on publicly available “external datasets” to prioritize sustainable design decisions, says sustainability consultant Adele Houghton.

Reconstruction & Renovation | Dec 21, 2017
Interactive map includes detailed information on historic New York City buildings
The New York City Landmarks Preservation Commission launched a new, enhanced version of its interactive map, Discover NYC Landmarks.

High-rise Construction | Dec 20, 2017
Another record year for high-rise construction
More than 140 skyscrapers were completed across the globe this year, including 15 supertall towers.

Game Changers | Dec 20, 2017
Urban farms can help plant seeds for cities’ growth around them
Urban farms have been impacting cities’ agribusiness—and, on some cases, their redevelopment—for decades.
 reported the November ABI score was 55.0, up from a score of 51.7 in the previous month. Photo: Pixabay")
Market Data | Dec 20, 2017
Architecture billings upturn shows broad strength
The American Institute of Architects (AIA) reported the November ABI score was 55.0, up from a score of 51.7 in the previous month.
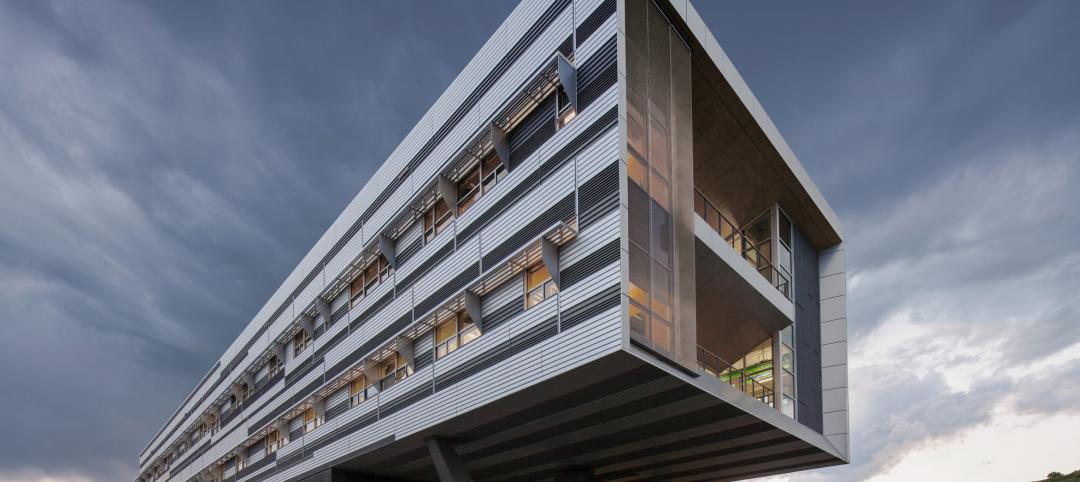
Public Health Labs | Dec 19, 2017
10 takeaways from SmithGroup’s ‘lab of the future’ initiative
The LAB2050 initiative digs into the scientific trends, technologies, and economics that will shape tomorrow’s research laboratory environments.
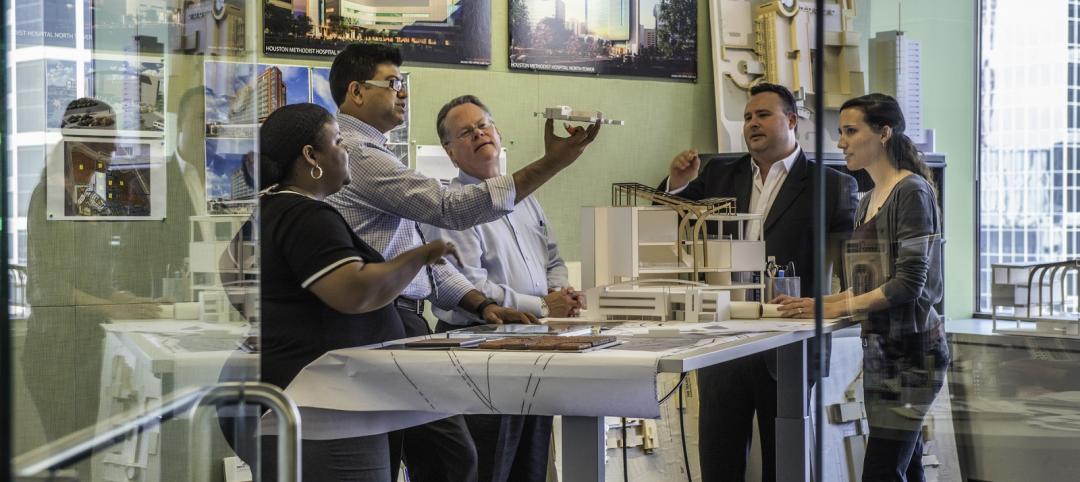
Office Buildings | Dec 19, 2017
How do we measure human performance, and what does it mean for the workplace?
There are many new tools and methods that are beginning to look more comprehensively to evaluate organizational well-being.
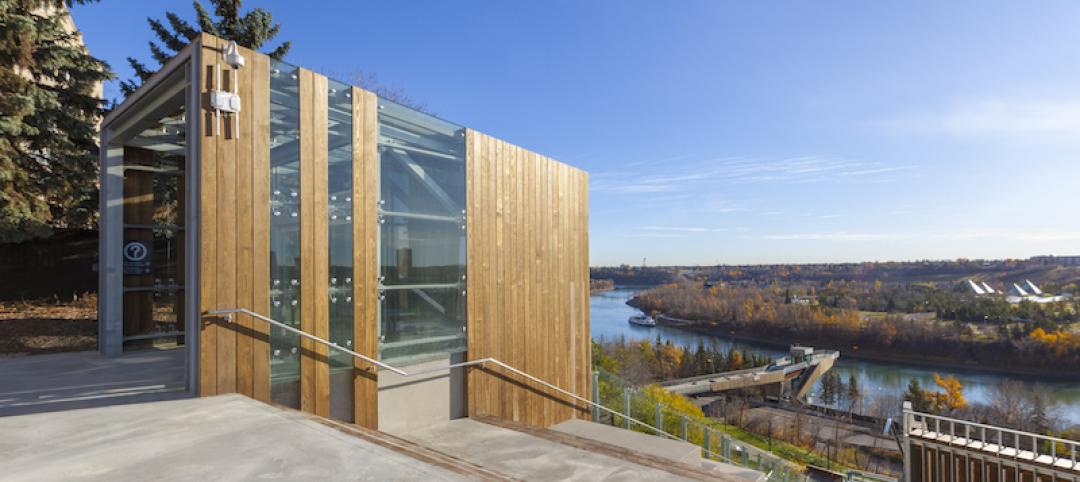
Sports and Recreational Facilities | Dec 18, 2017
Canada’s newest funicular makes Edmonton’s largest green space more accessible
The incline elevator is located in downtown Edmonton and was publicly funded.


