


Top State Government Sector Architecture Firms
| Rank | Company | 2013 State Government Revenue |
| 1 | Stantec | $75,267,246 |
| 2 | Heery International | $40,493,683 |
| 3 | SmithGroupJJR | $28,319,322 |
| 4 | DLR Group | $17,000,000 |
| 5 | SHW Group | $15,991,000 |
| 6 | Moseley Architects | $15,016,516 |
| 7 | RS&H | $12,250,000 |
| 8 | HDR | $11,315,904 |
| 9 | EYP Architecture & Engineering | $10,000,000 |
| 10 | NBBJ | $5,433,000 |
| 11 | Hammel, Green and Abrahamson | $5,093,838 |
| 12 | HOK | $4,949,000 |
| 13 | Fentress Architects | $4,899,541 |
| 14 | ZGF Architects | $4,849,113 |
| 15 | Perkins+will | $4,792,619 |
| 16 | Becker Morgan Group | $4,097,716 |
| 17 | HKS | $3,346,069 |
| 18 | Leo A Daly | $3,215,099 |
| 19 | Carrier Johnson + Culture | $3,204,174 |
| 20 | LaBella Associates | $3,035,000 |
| 21 | Rosser International | $2,737,756 |
| 22 | NORR | $2,673,090 |
| 23 | Goodwyn Mills & Cawood | $2,589,154 |
| 24 | RTKL Associates | $2,515,000 |
| 25 | GWWO | $1,873,874 |
| 26 | Gensler | $1,856,771 |
| 27 | Hoffmann Architects | $1,583,000 |
| 28 | Ennead Architects | $1,424,000 |
| 29 | Gresham, Smith and Partners | $1,336,000 |
| 30 | Cambridge Seven Associates | $1,210,000 |
| 31 | FXFOWLE Architects | $1,180,000 |
| 32 | EwingCole | $1,100,000 |
| 33 | KZF Design | $1,075,969 |
| 34 | Clark Nexsen | $1,054,623 |
| 35 | RSP Architects | $1,020,000 |
| 36 | Swanke Hayden Connell Architects | $925,000 |
| 37 | Perkins Eastman | $835,000 |
| 38 | Corgan | $762,894 |
| 39 | CTA Architects Engineers | $760,921 |
| 40 | CO Architects | $735,300 |
| 41 | Schrader Group Architecture | $649,979 |
| 42 | Beyer Blinder Belle | $607,356 |
| 43 | RNL | $602,000 |
| 44 | Bergmann Associates | $589,560 |
| 45 | Legat Architects | $584,700 |
| 46 | Symmes Maini & McKee Associates | $565,000 |
| 47 | Ratio Architects | $562,919 |
| 48 | Parkhill, Smith & Cooper | $556,000 |
| 49 | Commonwealth Architects | $546,756 |
| 50 | SchenkelShultz Architecture | $542,000 |
| 51 | Morris Architects | $400,000 |
| 52 | Flad Architects | $369,247 |
| 53 | Epstein | $321,000 |
| 54 | OZ Architecture | $257,312 |
| 55 | BRPH | $200,000 |
| 56 | LMN Architects | $192,500 |
| 57 | Emersion Design | $185,984 |
| 58 | HNTB Corp. | $162,624 |
| 59 | LS3P | $143,648 |
| 60 | Baskervill | $127,593 |
| 61 | LawKingdon Architecture | $100,000 |
| 62 | Kirksey | $74,645 |
| 63 | Cuningham Group Architecture | $66,998 |
| 64 | Integrus Architecture | $26,829 |
| 65 | Sherlock, Smith & Adams | $2,000 |
Top State Government Sector Engineering Firms
| Rank | Company | 2013 State Government Revenue |
| 1 | AECOM Technology Corp. | $117,900,000 |
| 2 | URS Corp. | $48,225,313 |
| 3 | Jacobs | $25,886,021 |
| 4 | Burns & McDonnell | $24,152,332 |
| 5 | STV | $15,666,000 |
| 6 | Simpson Gumpertz & Heger | $10,150,000 |
| 7 | Dewberry | $7,421,759 |
| 8 | Parsons Brinckerhoff | $7,420,007 |
| 9 | Thornton Tomasetti | $6,951,939 |
| 10 | Arup | $6,234,642 |
| 11 | RMF Engineering | $3,300,000 |
| 12 | Coffman Engineers | $3,294,200 |
| 13 | Glumac | $3,044,636 |
| 14 | Wiss, Janney, Elstner Associates | $2,450,000 |
| 15 | KPFF Consulting Engineers | $2,000,000 |
| 16 | Joseph R. Loring & Associates | $2,000,000 |
| 17 | Shive-Hattery | $1,888,930 |
| 18 | WSP Group | $1,870,000 |
| 19 | Smith Seckman Reid | $1,752,739 |
| 20 | Vanderweil Engineers | $1,548,400 |
| 21 | Graef | $1,349,513 |
| 22 | Brinjac Engineering | $1,152,948 |
| 23 | TTG | $965,000 |
| 24 | Walker Parking Consultants | $850,000 |
| 25 | Aon Fire Protection Engineering Corp. | $694,930 |
| 26 | RDK Engineers | $680,000 |
| 27 | Interface Engineering | $646,210 |
| 28 | Davis, Bowen & Friedel | $622,980 |
| 29 | Highland Associates | $600,000 |
| 30 | CJL Engineering | $565,500 |
| 31 | AKF Group | $560,000 |
| 32 | H.F. Lenz | $555,000 |
| 33 | Newcomb & Boyd | $527,568 |
| 34 | KCI Technologies | $500,000 |
| 35 | I. C. Thomasson Associates | $500,000 |
| 36 | GRW | $465,320 |
| 37 | Dunham Associates | $400,000 |
| 38 | Syska Hennessy Group | $341,710 |
| 39 | Paulus, Sokolowski and Sartor | $260,000 |
| 40 | CTLGroup | $260,000 |
| 41 | Rist-Frost-Shumway Engineering | $250,000 |
| 42 | Spectrum Engineers | $228,684 |
| 43 | Affiliated Engineers | $197,000 |
| 44 | KJWW Engineering Consultants | $187,391 |
| 45 | French & Parrello Associates | $177,100 |
| 46 | Bridgers & Paxton Consulting Engineers | $171,232 |
| 47 | KLH Engineers | $160,317 |
| 48 | Barge Waggoner Sumner & Cannon | $155,000 |
| 49 | Guernsey | $123,196 |
| 50 | Primera Engineers | $113,000 |
| 51 | Henderson Engineers | $95,782 |
| 52 | TLC Engineering for Architecture | $92,488 |
| 53 | Wick Fisher White | $87,200 |
| 54 | Allen & Shariff | $61,000 |
| 55 | Integrated Design Group | $55,650 |
| 56 | Heapy Engineering | $46,515 |
| 57 | Wallace Engineering | $30,000 |
| 58 | Ross & Baruzzini | $17,338 |
| 59 | SSOE Group | $15,959 |
| 60 | H&A Architects & Engineers | $10,000 |
| 61 | Mazzetti | $6,351 |
| 62 | G&W Engineering Corp. | $1,400 |
| 63 | Walter P Moore and Associates | $700 |
Top State Government Sector Construction Firms
| Rank | Company | 2013 State Government Revenue |
| 1 | PCL Construction | $779,190,063 |
| 2 | Turner Construction | $764,648,641 |
| 3 | Clark Group | $693,355,701 |
| 4 | Tutor Perini Corp. | $281,677,101 |
| 5 | Gilbane | $196,149,000 |
| 6 | Hensel Phelps | $194,690,000 |
| 7 | Balfour Beatty US | $105,870,232 |
| 8 | Holder Construction | $102,678,000 |
| 9 | Walsh Group, The | $81,539,752 |
| 10 | JE Dunn Construction | $60,959,904 |
| 11 | McCarthy Holdings | $50,000,000 |
| 12 | Whiting-Turner Contracting Co., The | $49,083,377 |
| 13 | Fortis Construction | $48,985,000 |
| 14 | Heery International | $40,493,683 |
| 15 | Sundt Construction | $36,291,353 |
| 16 | Power Construction | $34,000,000 |
| 17 | Bernards | $32,000,000 |
| 18 | Kitchell Corp. | $26,111,107 |
| 19 | Absher Construction | $24,090,657 |
| 20 | CORE Construction Group | $23,101,686 |
| 21 | Hunt Companies | $21,513,243 |
| 22 | EMJ Corp. | $21,000,000 |
| 23 | Flintco | $19,243,203 |
| 24 | Suffolk Construction | $16,487,695 |
| 25 | Manhattan Construction | $16,373,000 |
| 26 | STV | $15,666,000 |
| 27 | Hill International | $15,000,000 |
| 28 | E.W. Howell | $9,198,000 |
| 29 | W. M. Jordan Company | $8,480,107 |
| 30 | Skanska USA | $8,020,469 |
| 31 | Yates Companies, The | $8,000,000 |
| 32 | Parsons Brinckerhoff | $7,420,007 |
| 33 | LeChase Construction Services | $6,560,000 |
| 34 | Consigli Construction | $5,144,943 |
| 35 | Layton Construction | $5,100,000 |
| 36 | Coakley & Williams Construction | $4,266,839 |
| 37 | JLL | $3,300,000 |
| 38 | Bomel Construction | $3,068,000 |
| 39 | Structure Tone | $2,998,100 |
| 40 | O'Neil Industries/W.E. O'Neil | $2,725,145 |
| 41 | Adolfson & Peterson Construction | $2,457,890 |
| 42 | BlueScope Construction | $1,601,039 |
| 43 | Astorino | $1,535,653 |
| 44 | Ryan Companies US | $1,053,637 |
| 45 | Graycor | $803,453 |
| 46 | Brasfield & Gorrie | $787,019 |
| 47 | Lend Lease | $350,000 |
| 48 | New South Construction | $323,000 |
| 49 | S. M. Wilson & Co. | $279,021 |
| 50 | Hoffman Construction | $141,000 |
| 51 | Hoar Construction | $108,000 |
| 52 | Allen & Shariff | $61,000 |
Read BD+C's full 2014 Giants 300 Report
Related Stories

| Jan 19, 2011
Museum design integrates Greek history and architecture
Construction is under way in Chicago on the National Hellenic Museum, the nation’s first museum devoted to Greek history and culture. RTKL designed the 40,000-sf limestone and glass building to include such historic references as the covered walkway of classical architecture and the natural wood accents of Byzantine monasteries. The museum will include a research library and oral history center, plus a 3,600-sf rooftop terrace featuring three gardens. The project seeks LEED Silver.
| Jan 19, 2011
Architecture Billings Index jumped more than 2 points in December
On the heels of its highest mark since 2007, the Architecture Billings Index jumped more than two points in December. The American Institute of Architects reported the December ABI score was 54.2, up from a reading of 52.0 the previous month.
| Jan 19, 2011
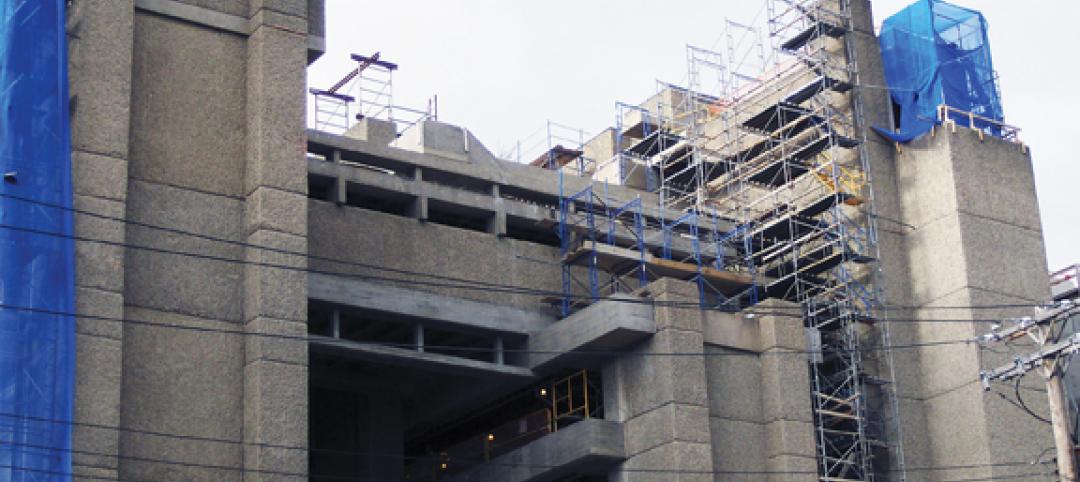
Large-Scale Concrete Reconstruction Solid Thinking
Driven by both current economic conditions and sustainable building trends, Building Teams are looking more and more to retrofits and reconstruction as the most viable alternative to new construction. In that context, large-scale concrete restoration projects are playing an important role within this growing specialty.

| Jan 10, 2011
Architect Jean Nouvel designs an island near Paris
Abandoned by carmaker Renault almost 20 years ago, Seguin Island in Boulogne-Billancourt, France, is being renewed by architect Jean Nouvel. Plans for the 300,000-square-meter project includes a mix of culture, commerce, urban parks, and gardens, which officials hope will attract both Parisians and tourists.

| Jan 10, 2011
Michael J. Alter, president of The Alter Group: ‘There’s a significant pent-up demand for projects’
Michael J. Alter, president of The Alter Group, a national corporate real estate development firm headquartered in Skokie, Ill., on the growth of urban centers, project financing, and what clients are saying about sustainability.
| Jan 7, 2011
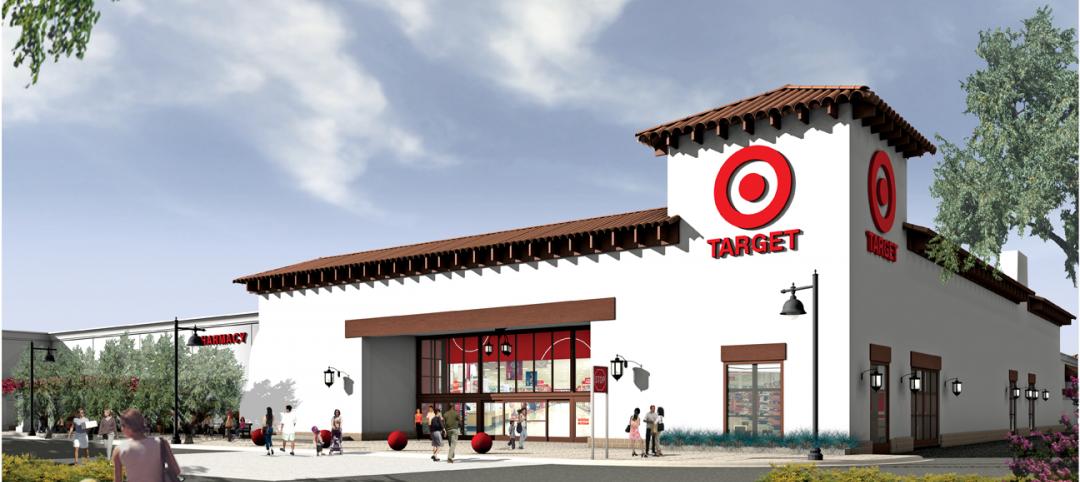
BIM on Target
By using BIM for the design of its new San Clemente, Calif., store, big-box retailer Target has been able to model the entire structural steel package, including joists, in 3D, chopping the timeline for shop drawings from as much as 10 weeks down to an ‘unheard of’ three-and-a-half weeks.
| Jan 7, 2011
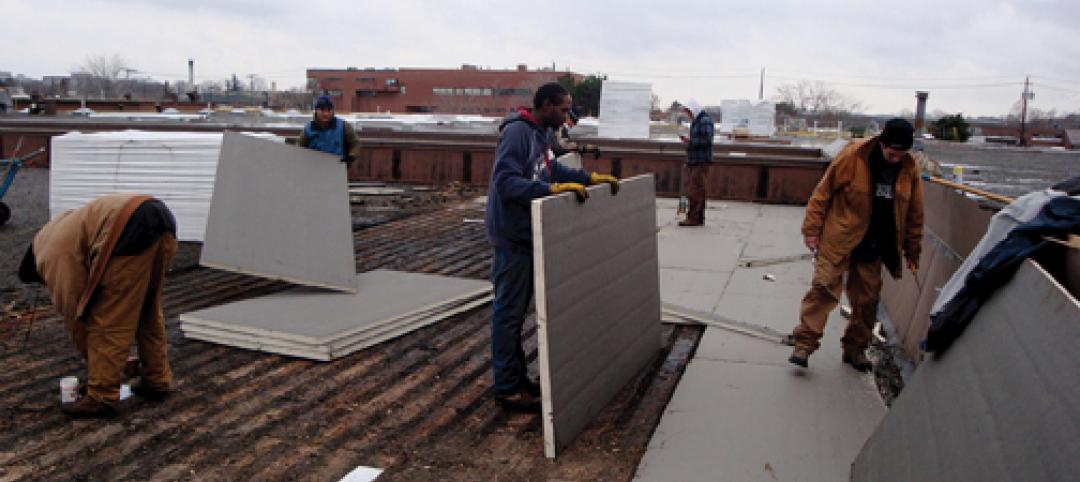
How Building Teams Choose Roofing Systems
A roofing survey emailed to a representative sample of BD+C’s subscriber list revealed such key findings as: Respondents named metal (56%) and EPDM (50%) as the roofing systems they (or their firms) employed most in projects. Also, new construction and retrofits were fairly evenly split among respondents’ roofing-related projects over the last couple of years.

| Jan 7, 2011
Total construction to rise 5.1% in 2011
Total U.S. construction spending will increase 5.1% in 2011. The gain from the end of 2010 to the end of 2011 will be 10%. The biggest annual gain in 2011 will be 10% for new residential construction, far above the 2-3% gains in all other construction sectors.
| Jan 7, 2011
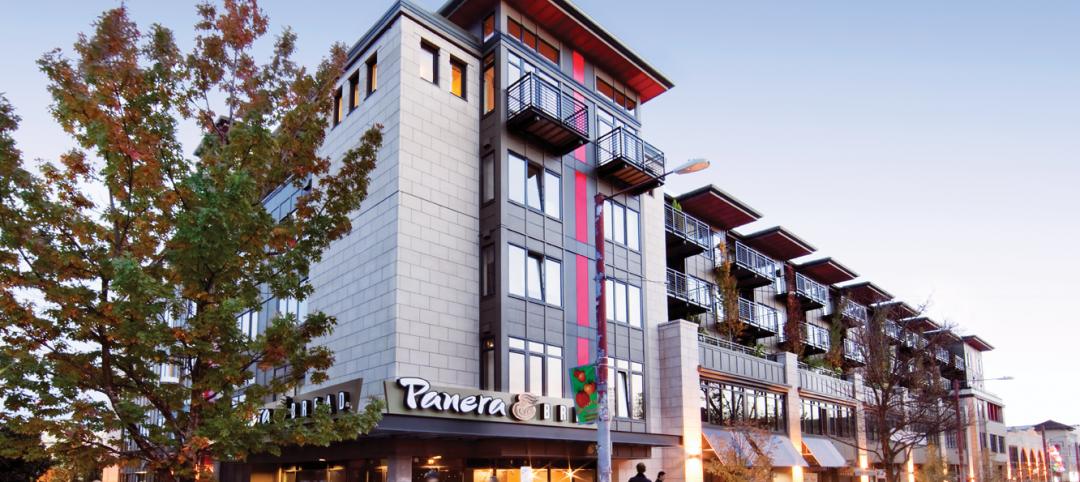
Mixed-Use on Steroids
Mixed-use development has been one of the few bright spots in real estate in the last few years. Successful mixed-use projects are almost always located in dense urban or suburban areas, usually close to public transportation. It’s a sign of the times that the residential component tends to be rental rather than for-sale.


