


Top Sports Facility Architecture Firms
| Rank | Company | 2013 Sports Facility Revenue |
| 1 | Populous | $95,132,000 |
| 2 | HKS | $33,157,982 |
| 3 | Heery International | $28,673,466 |
| 4 | Gensler | $17,465,000 |
| 5 | Moody Nolan | $16,909,220 |
| 6 | Stantec | $9,094,142 |
| 7 | HNTB Corp. | $8,650,386 |
| 8 | DLR Group | $7,900,000 |
| 9 | Perkins+will | $7,400,000 |
| 10 | Hastings+Chivetta Architects | $6,170,589 |
| 11 | NORR | $4,355,328 |
| 12 | Clark Nexsen | $4,336,949 |
| 13 | LPA | $4,121,368 |
| 14 | PBK | $4,120,000 |
| 15 | HDR | $3,700,000 |
| 16 | EwingCole | $3,620,000 |
| 17 | Solomon Cordwell Buenz | $2,500,000 |
| 18 | NBBJ | $2,321,000 |
| 19 | Wight & Company | $2,126,000 |
| 20 | KZF Design | $1,911,423 |
| 21 | Good Fulton & Farrell | $1,875,500 |
| 22 | Rosser International | $1,620,713 |
| 23 | Perkins Eastman | $1,550,000 |
| 24 | S/L/A/M Collaborative, The | $1,505,676 |
| 25 | Ratio Architects | $1,448,672 |
| 26 | Goodwyn Mills & Cawood | $1,389,959 |
| 27 | Parkhill, Smith & Cooper | $1,145,000 |
| 28 | WATG | Wimberly Interiors | $1,075,000 |
| 29 | TEG Architects | $967,874 |
| 30 | Symmes Maini & McKee Associates | $935,000 |
| 31 | Hammel, Green and Abrahamson | $916,831 |
| 32 | BBS Architects | $782,753 |
| 33 | ZGF Architects | $718,437 |
| 34 | CTA Architects Engineers | $707,888 |
| 35 | FGM Architects | $685,882 |
| 36 | PGAL | $629,400 |
| 37 | Becker Morgan Group | $598,825 |
| 38 | HOK | $567,281 |
| 39 | Baskervill | $431,684 |
| 40 | LS3P | $371,055 |
| 41 | SchenkelShultz Architecture | $319,000 |
| 42 | ai Design Group | $311,665 |
| 43 | BLDD Architects | $290,000 |
| 44 | NAC|Architecture | $284,669 |
| 45 | VOA Associates | $219,061 |
| 46 | Smallwood, Reynolds, Stewart, Stewart & Associates | $213,788 |
| 47 | LaBella Associates | $178,651 |
| 48 | Cuningham Group Architecture | $167,124 |
| 49 | JRS Architect | $135,000 |
| 50 | Skidmore, Owings & Merrill | $110,909 |
| 51 | DLA Architects | $108,030 |
| 52 | RTKL Associates | $107,000 |
| 53 | Nadel | $100,000 |
| 54 | RSP Architects | $51,000 |
| 55 | Hensley Lamkin Rachel | $50,000 |
| 56 | Cooper Carry | $44,330 |
| 57 | FitzGerald Associates Architects | $28,400 |
| 58 | Nelson | $9,085 |
| 59 | Hoffmann Architects | $1,000 |
Top Sports Facility Engineering Firms
| Rank | Company | 2013 Sports Facility Revenue |
| 1 | AECOM Technology Corp. | $36,570,000 |
| 2 | M-E Engineers | $16,383,000 |
| 3 | Thornton Tomasetti | $15,697,265 |
| 4 | Walter P Moore and Associates | $11,665,163 |
| 5 | URS Corp. | $5,775,033 |
| 6 | Arup | $5,128,395 |
| 7 | Environmental Systems Design | $5,081,574 |
| 8 | Jacobs | $4,990,000 |
| 9 | Henderson Engineers | $4,411,124 |
| 10 | Smith Seckman Reid | $3,713,991 |
| 11 | WSP Group | $2,860,000 |
| 12 | Magnusson Klemencic Associates | $2,566,150 |
| 13 | Wiss, Janney, Elstner Associates | $2,050,000 |
| 14 | Rist-Frost-Shumway Engineering | $2,000,000 |
| 15 | Parsons Brinckerhoff | $1,879,924 |
| 16 | Martin/Martin | $1,512,718 |
| 17 | Fishbeck, Thompson, Carr & Huber | $1,500,000 |
| 18 | Dewberry | $1,407,631 |
| 19 | Simpson Gumpertz & Heger | $1,330,000 |
| 20 | TLC Engineering for Architecture | $1,244,948 |
| 21 | RDK Engineers | $660,000 |
| 22 | CTLGroup | $610,000 |
| 23 | Primera Engineers | $545,000 |
| 24 | STV | $527,000 |
| 25 | RMF Engineering | $500,000 |
| 26 | Aon Fire Protection Engineering Corp. | $500,000 |
| 27 | OLA Consulting Engineers | $488,000 |
| 28 | Davis, Bowen & Friedel | $460,870 |
| 29 | French & Parrello Associates | $455,000 |
| 30 | DeSimone Consulting Engineers | $428,684 |
| 31 | KPFF Consulting Engineers | $400,000 |
| 32 | Interface Engineering | $392,626 |
| 33 | TTG | $375,100 |
| 34 | Graef | $300,000 |
| 35 | Guernsey | $299,110 |
| 36 | Syska Hennessy Group | $294,231 |
| 37 | KJWW Engineering Consultants | $255,541 |
| 38 | Highland Associates | $250,000 |
| 39 | Affiliated Engineers | $213,000 |
| 40 | Sparling | $202,539 |
| 41 | Shive-Hattery | $195,346 |
| 42 | Bridgers & Paxton Consulting Engineers | $168,695 |
| 43 | I. C. Thomasson Associates | $150,000 |
| 44 | Coffman Engineers | $125,252 |
| 45 | Dunham Associates | $75,000 |
| 46 | Wick Fisher White | $74,527 |
| 47 | Vanderweil Engineers | $60,500 |
| 48 | Paulus, Sokolowski and Sartor | $60,000 |
| 49 | Barge Waggoner Sumner & Cannon | $60,000 |
| 50 | Brinjac Engineering | $59,892 |
| 51 | Mazzetti | $54,558 |
| 52 | Allen & Shariff | $40,000 |
| 53 | SSOE Group | $34,837 |
| 54 | Zak Companies | $23,203 |
| 55 | CJL Engineering | $19,800 |
| 56 | Newcomb & Boyd | $19,444 |
| 57 | Karpinski Engineering | $17,151 |
| 58 | Spectrum Engineers | $7,365 |
Top Sports Facility Construction Firms
| Rank | Company | 2013 Sports Facility Revenue |
| 1 | Turner Construction | $725,410,000 |
| 2 | Mortenson Construction | $426,600,000 |
| 3 | Hunt Construction Group | $292,000,000 |
| 4 | PCL Construction | $208,924,043 |
| 5 | Barton Malow | $133,889,816 |
| 6 | Austin Commercial | $130,667,014 |
| 7 | JE Dunn Construction | $106,383,161 |
| 8 | Paric Corp. | $100,000,000 |
| 9 | Hoffman Construction | $94,000,000 |
| 10 | Flintco | $59,800,000 |
| 11 | Manhattan Construction | $56,910,000 |
| 12 | C.W. Driver | $54,160,000 |
| 13 | Brasfield & Gorrie | $51,829,848 |
| 14 | Tutor Perini Corp. | $51,420,746 |
| 15 | Whiting-Turner Contracting Co., The | $40,432,202 |
| 16 | Heery International | $28,673,466 |
| 17 | Bernards | $28,000,000 |
| 18 | Yates Companies, The | $22,000,000 |
| 19 | Balfour Beatty US | $21,059,934 |
| 20 | Robins & Morton | $19,205,076 |
| 21 | Layton Construction | $17,900,000 |
| 22 | Absher Construction | $17,818,038 |
| 23 | Wight & Company | $16,973,000 |
| 24 | Rodgers Builders | $15,687,359 |
| 25 | Messer Construction | $14,139,754 |
| 26 | James McHugh Construction | $13,604,799 |
| 27 | Skanska USA | $13,404,638 |
| 28 | Weitz Company, The | $12,619,586 |
| 29 | Hill & Wilkinson | $11,975,000 |
| 30 | O'Neil Industries/W.E. O'Neil | $10,623,002 |
| 31 | LPCiminelli | $10,481,510 |
| 32 | Clark Group | $10,179,966 |
| 33 | Hensel Phelps | $9,550,000 |
| 34 | Hill International | $8,000,000 |
| 35 | McGough | $7,000,000 |
| 36 | Hoar Construction | $6,870,000 |
| 37 | Leopardo Companies | $6,777,423 |
| 38 | Ryan Companies US | $6,666,280 |
| 39 | Batson-Cook | $6,430,161 |
| 40 | Adolfson & Peterson Construction | $6,390,953 |
| 41 | CORE Construction Group | $6,187,987 |
| 42 | Coakley & Williams Construction | $4,954,897 |
| 43 | Boldt Company, The | $4,249,279 |
| 44 | Pepper Construction | $4,210,000 |
| 45 | Gilbane | $2,773,200 |
| 46 | Suffolk Construction | $2,531,269 |
| 47 | New South Construction | $1,939,000 |
| 48 | Parsons Brinckerhoff | $1,879,924 |
| 49 | Stalco Construction | $1,400,000 |
| 50 | Choate Construction | $1,260,092 |
| 51 | S. M. Wilson & Co. | $1,060,764 |
| 52 | Lend Lease | $744,000 |
| 53 | Bette Companies, The | $584,000 |
| 54 | STV | $527,000 |
| 55 | W. M. Jordan Company | $445,266 |
| 56 | DPR Construction | $435,138 |
| 57 | Alberici Constructors | $138,465 |
| 58 | Bomel Construction | $64,285 |
| 59 | Allen & Shariff | $40,000 |
| 60 | KBE Building Corp. | $39,353 |
| 61 | Astorino | $29,121 |
Read BD+C's full 2014 Giants 300 Report
Related Stories

| Sep 24, 2014
Architecture billings see continued strength, led by institutional sector
On the heels of recording its strongest pace of growth since 2007, there continues to be an increasing level of demand for design services signaled in the latest Architecture Billings Index.

| Sep 24, 2014
Frank Gehry's first building in Latin America will host grand opening on Oct. 2
Gehry's design for the Biomuseo, or Museum of Biodiversity, draws inspiration from the site's natural and cultural surroundings, including local Panamaian tin roofs.
| Sep 23, 2014
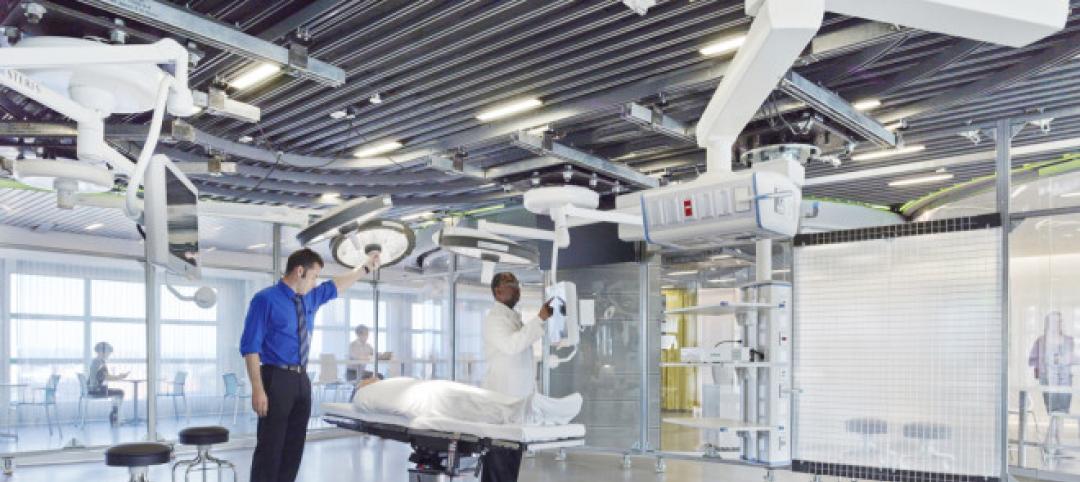
Cedars-Sinai looks to streamline trauma care with first-of-its-kind OR360 simulation space
The breakthrough simulation center features moveable walls and a modular ceiling grid that allow doctors and military personnel to easily reconfigure the shape and size of the space.

| Sep 23, 2014
Third phase of New York’s High Line redevelopment opens
The $35 million Phase 3, known as High Line at the Rail Yards, broke ground September 20, 2012, and officially opened to the public on September 21.

| Sep 23, 2014
Cloud-shaped skyscraper complex wins Shenzhen Bay Super City design competition
Forget the cubist, clinical, glass and concrete jungle of today's financial districts. Shenzhen's new plan features a complex of cloud-shaped skyscrapers connected to one another with sloping bridges.

| Sep 23, 2014
Designing with Water: Report analyzes ways coastal cities can cope with flooding
The report contains 12 case studies of cities around the world that have applied advanced flood management techniques.
| Sep 22, 2014
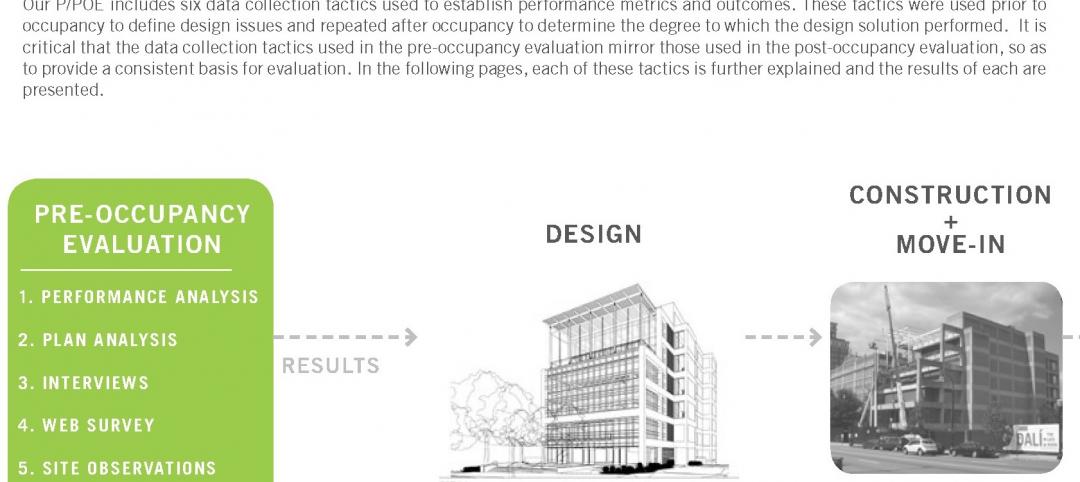
4 keys to effective post-occupancy evaluations
Perkins+Will's Janice Barnes covers the four steps that designers should take to create POEs that provide design direction and measure design effectiveness.

| Sep 22, 2014
NCARB overhauls Intern Development Program, cuts years off licensure process
The newly adopted changes will be implemented in two phases. The first will streamline the program by focusing on the IDP’s core requirements and removing its elective requirements. The second phase will condense the 17 current experience areas into six practice-based categories.

| Sep 22, 2014
Biloxi’s new Maritime and Seafood Industry Museum is like a ship in a bottle
Nine years after the Museum of Maritime and Seafood Industry in Biloxi, Miss., was damaged by Hurricane Katrina’s 30-foot tidal surge, the museum reopened its doors in a brand new, H3-designed building.

| Sep 22, 2014
Swanke-designed Eurasia Tower opens in Moscow
The 72-story tower—the first mixed-use, steel tower in Russia—is located within the new, 30 million-sf, 148-acre Moscow International Business Center.


