


Top Military Sector Architecture Firms
| Rank | Company | 2013 Military Sector Revenue |
| 1 | HDR | $38,334,666 |
| 2 | Heery International | $22,045,945 |
| 3 | SmithGroupJJR | $15,940,811 |
| 4 | Clark Nexsen | $12,924,606 |
| 5 | EwingCole | $8,800,000 |
| 6 | LS3P | $7,728,688 |
| 7 | RS&H | $7,350,000 |
| 8 | HKS | $6,586,272 |
| 9 | Hoefer Wysocki Architecture | $6,435,000 |
| 10 | Leo A Daly | $6,421,793 |
| 11 | VOA Associates | $6,148,434 |
| 12 | Sherlock, Smith & Adams | $5,454,000 |
| 13 | Parkhill, Smith & Cooper | $4,764,000 |
| 14 | SchenkelShultz Architecture | $4,267,000 |
| 15 | EYP Architecture & Engineering | $3,800,000 |
| 16 | Morris Architects | $3,400,000 |
| 17 | BRPH | $3,153,000 |
| 18 | ZGF Architects | $3,027,156 |
| 19 | HNTB Corp. | $2,965,383 |
| 20 | RSP Architects | $2,906,000 |
| 21 | Flad Architects | $2,881,411 |
| 22 | Perkins+will | $2,864,234 |
| 23 | Rosser International | $2,706,849 |
| 24 | KZF Design | $2,665,030 |
| 25 | CTA Architects Engineers | $2,414,575 |
| 26 | Hammel, Green and Abrahamson | $2,137,388 |
| 27 | WHR Architects | $2,076,445 |
| 28 | Integrus Architecture | $1,941,923 |
| 29 | Emersion Design | $1,637,645 |
| 30 | RNL | $1,510,000 |
| 31 | Wight & Company | $1,183,093 |
| 32 | HOK | $1,064,000 |
| 33 | Symmes Maini & McKee Associates | $760,000 |
| 34 | PGAL | $736,900 |
| 35 | RTKL Associates | $713,000 |
| 36 | Skidmore, Owings & Merrill | $528,869 |
| 37 | Fentress Architects | $521,000 |
| 38 | Gresham, Smith and Partners | $417,000 |
| 39 | Cooper Carry | $317,590 |
| 40 | Harvard Jolly Architecture | $256,969 |
| 41 | Beyer Blinder Belle | $245,182 |
| 42 | OZ Architecture | $236,188 |
| 43 | Carrier Johnson + Culture | $162,717 |
| 44 | FGM Architects | $151,212 |
| 45 | Cuningham Group Architecture | $143,448 |
| 46 | LawKingdon Architecture | $100,000 |
| 47 | Moseley Architects | $72,455 |
| 48 | Becker Morgan Group | $44,583 |
| 49 | Commonwealth Architects | $24,249 |
Top Military Sector Engineering Firms
| Rank | Company | 2013 Military Sector Revenue |
| 1 | Fluor Corporation | $1,587,385,069 |
| 2 | URS Corp. | $423,543,990 |
| 3 | AECOM Technology Corp. | $281,200,000 |
| 4 | Jacobs | $70,855,779 |
| 5 | Leidos | $49,612,500 |
| 6 | Allen & Shariff | $33,363,317 |
| 7 | Burns & McDonnell | $24,000,000 |
| 8 | Guernsey | $8,144,346 |
| 9 | Parsons Brinckerhoff | $5,807,647 |
| 10 | Affiliated Engineers | $5,472,000 |
| 11 | STV | $4,451,000 |
| 12 | H&A Architects & Engineers | $3,750,000 |
| 13 | Dewberry | $3,298,559 |
| 14 | Coffman Engineers | $3,236,096 |
| 15 | KPFF Consulting Engineers | $3,000,000 |
| 16 | KCI Technologies | $3,000,000 |
| 17 | RMF Engineering | $2,800,000 |
| 18 | Barge Waggoner Sumner & Cannon | $2,625,000 |
| 19 | Newcomb & Boyd | $2,033,616 |
| 20 | I. C. Thomasson Associates | $2,000,000 |
| 21 | Sparling | $1,788,836 |
| 22 | Ross & Baruzzini | $1,628,384 |
| 23 | TLC Engineering for Architecture | $1,525,695 |
| 24 | M-E Engineers | $1,400,000 |
| 25 | Smith Seckman Reid | $1,273,546 |
| 26 | SSOE Group | $1,078,835 |
| 27 | Vanderweil Engineers | $897,500 |
| 28 | GRW | $895,200 |
| 29 | Henderson Engineers | $855,580 |
| 30 | TTG | $825,000 |
| 31 | H.F. Lenz | $801,450 |
| 32 | Heapy Engineering | $548,198 |
| 33 | Bridgers & Paxton Consulting Engineers | $491,612 |
| 34 | Apogee Consulting Group | $488,274 |
| 35 | Spectrum Engineers | $432,748 |
| 36 | Walker Parking Consultants | $425,000 |
| 37 | Davis, Bowen & Friedel | $369,046 |
| 38 | KJWW Engineering Consultants | $354,600 |
| 39 | Interface Engineering | $348,341 |
| 40 | Syska Hennessy Group | $309,356 |
| 41 | Wiss, Janney, Elstner Associates | $300,000 |
| 42 | CTLGroup | $260,000 |
| 43 | Dunham Associates | $250,000 |
| 44 | Simpson Gumpertz & Heger | $200,000 |
| 45 | WSP Group | $150,000 |
| 46 | Shive-Hattery | $132,000 |
| 47 | CJL Engineering | $87,000 |
| 48 | Brinjac Engineering | $51,306 |
| 49 | Total Building Commissioning | $41,361 |
| 50 | Paulus, Sokolowski and Sartor | $40,000 |
| 51 | Walter P Moore and Associates | $14,739 |
| 52 | AKF Group | $9,000 |
Top Military Sector Construction Firms
| Rank | Company | 2013 Military Sector Revenue |
| 1 | Balfour Beatty US | $682,047,610 |
| 2 | Lend Lease | $503,929,000 |
| 3 | Hensel Phelps | $342,770,000 |
| 4 | Walsh Group, The | $326,159,009 |
| 5 | Gilbane | $315,818,000 |
| 6 | Turner Construction | $278,261,087 |
| 7 | Clark Group | $256,754,714 |
| 8 | McCarthy Holdings | $223,000,000 |
| 9 | Whiting-Turner Contracting Co., The | $175,124,234 |
| 10 | Mortenson Construction | $145,940,000 |
| 11 | W. M. Jordan Company | $100,007,479 |
| 12 | JE Dunn Construction | $92,780,599 |
| 13 | Hunt Companies | $90,253,000 |
| 14 | Tutor Perini Corp. | $89,201,797 |
| 15 | Skanska USA | $87,924,473 |
| 16 | Hunt Construction Group | $87,600,000 |
| 17 | B. L. Harbert International | $74,365,423 |
| 18 | Brasfield & Gorrie | $66,588,962 |
| 19 | Suffolk Construction | $49,230,005 |
| 20 | Manhattan Construction | $44,612,000 |
| 21 | Sundt Construction | $44,423,513 |
| 22 | Leopardo Companies | $41,008,580 |
| 23 | KBE Building Corp. | $34,356,210 |
| 24 | Allen & Shariff | $33,363,317 |
| 25 | CORE Construction Group | $31,042,120 |
| 26 | Consigli Construction | $29,720,291 |
| 27 | Haskell | $28,573,183 |
| 28 | Robins & Morton | $28,415,079 |
| 29 | Coakley & Williams Construction | $25,895,406 |
| 30 | Heery International | $22,045,945 |
| 31 | Walbridge | $18,300,000 |
| 32 | C.W. Driver | $17,470,000 |
| 33 | S. M. Wilson & Co. | $16,238,559 |
| 34 | Hoffman Construction | $14,813,000 |
| 35 | HITT Contracting | $14,590,000 |
| 36 | Flintco | $14,425,656 |
| 37 | PCL Construction | $13,434,311 |
| 38 | Harkins Builders | $12,000,000 |
| 39 | BlueScope Construction | $11,775,063 |
| 40 | Juneau Construction | $11,405,546 |
| 41 | Yates Companies, The | $10,000,000 |
| 42 | Hoar Construction | $9,480,000 |
| 43 | Messer Construction | $9,315,973 |
| 44 | Bomel Construction | $6,950,000 |
| 45 | Hill International | $6,000,000 |
| 46 | Parsons Brinckerhoff | $5,807,647 |
| 47 | New South Construction | $5,623,000 |
| 48 | STV | $4,451,000 |
| 49 | Fortis Construction | $3,300,000 |
| 50 | Beck Group, The | $2,997,098 |
| 51 | Weitz Company, The | $2,600,000 |
| 52 | JLL | $900,000 |
| 53 | Choate Construction | $765,945 |
| 54 | DPR Construction | $233,519 |
| 55 | Kitchell Corp. | $229,905 |
| 56 | Wight & Company | $145,000 |
Read BD+C's full 2014 Giants 300 Report
Related Stories

Market Data | Jan 30, 2018
AIA Consensus Forecast: 4.0% growth for nonresidential construction spending in 2018
The commercial office and retail sectors will lead the way in 2018, with a strong bounce back for education and healthcare.

Architects | Jan 29, 2018
14 marketing resolutions AEC firms should make in 2018
As we close out the first month of the New Year, AEC firms have made (and are still making) plans for where and how to spend their marketing time and budgets in 2018.
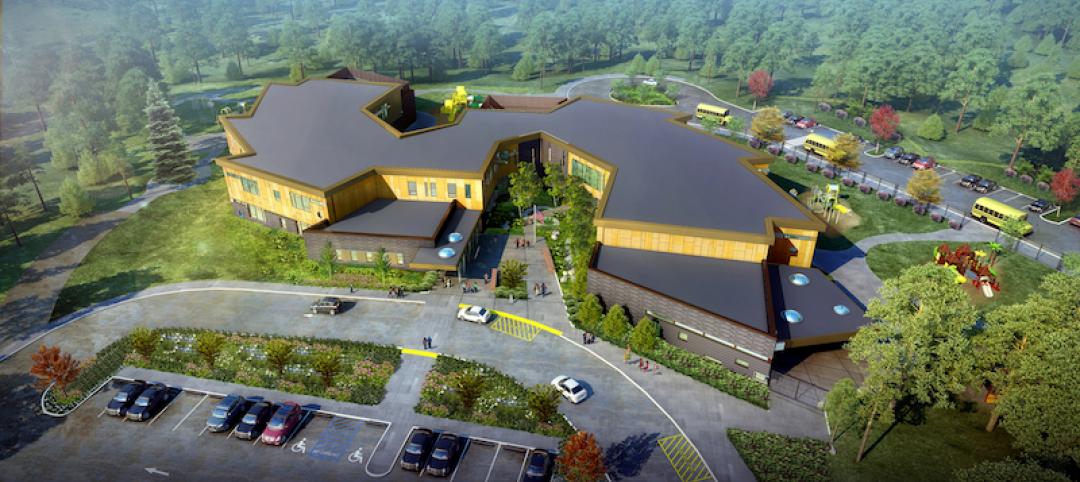
Education Facilities | Jan 29, 2018
My day as a kindergartner
The idea of a kindergarten-only school presents both challenges and opportunities in regards to the design.

AEC Tech | Jan 29, 2018
thyssenkrupp tests self-driving robot for ‘last mile’ delivery of elevator parts
“With driverless delivery robots, we could fill a gap and get spare parts from our warehouses to the jobsite faster,” said thyssenkrupp SVP Ivo Siebers.

Architects | Jan 26, 2018
Stephen Ayers, FAIA, honored with the 2018 AIA Thomas Jefferson Award
The award honors significant contributions to public architecture.
Architects | Jan 26, 2018
Recipients for the 2018 Collaborative Achievement Award selected
The recipients will be honored at the AIA Conference on Architecture 2018 in New York City.

K-12 Schools | Jan 25, 2018
Cost estimating for K-12 school projects: An invaluable tool for budget management
Clients want to be able to track costs at every stage of a project, and cost estimates (current and life cycle) are valuable planning and design tools, writes LS3P's Ginny Magrath, AIA.

Architects | Jan 25, 2018
Four keys to designing autistic-friendly spaces
Autism, in part, gave us modern architecture, writes PDR’s Julie Troung.

Sports and Recreational Facilities | Jan 25, 2018
Virginia Beach: A surf town with a wave problem no more
A world-class surf park will highlight Virginia Beach’s new live-work-play development.

Multifamily Housing | Jan 24, 2018
Apartment rent rates jump 2.5% in 2017, led by small and mid-sized markets
The average price for one-bedroom units increased the most.


