

 Fire Station #4. Photo: courtesy HDR")
Top Local Government Sector Architecture Firms
| Rank | Company | 2013 Local Government Revenue |
| 1 | HOK | $55,452,267 |
| 2 | Stantec | $49,405,105 |
| 3 | Heery International | $44,704,482 |
| 4 | SHW Group | $40,016,000 |
| 5 | FreemanWhite | $25,833,487 |
| 6 | Moseley Architects | $20,046,498 |
| 7 | Skidmore, Owings & Merrill | $19,897,809 |
| 8 | PGAL | $15,361,017 |
| 9 | SmithGroupJJR | $14,348,220 |
| 10 | Quattrocchi Kwok Architects | $13,230,000 |
| 11 | Gensler | $13,040,471 |
| 12 | RS&H | $12,250,000 |
| 13 | BLDD Architects | $11,800,000 |
| 14 | Perkins+will | $9,226,704 |
| 15 | Clark Nexsen | $8,809,308 |
| 16 | HNTB Corp. | $8,423,750 |
| 17 | HKS | $6,837,590 |
| 18 | SchenkelShultz Architecture | $6,469,000 |
| 19 | Fentress Architects | $6,419,230 |
| 20 | LMN Architects | $6,195,600 |
| 21 | HDR | $6,188,900 |
| 22 | NBBJ | $6,034,000 |
| 23 | HMC Architects | $5,693,289 |
| 24 | LaBella Associates | $5,095,000 |
| 25 | ZGF Architects | $4,706,985 |
| 26 | Harley Ellis Devereaux | $4,310,000 |
| 27 | Hammel, Green and Abrahamson | $4,156,642 |
| 28 | FGM Architects | $3,625,486 |
| 29 | Leo A Daly | $3,577,658 |
| 30 | Wight & Company | $3,219,000 |
| 31 | Morris Architects | $2,700,000 |
| 32 | Page | $2,522,000 |
| 33 | Beyer Blinder Belle | $2,433,253 |
| 34 | DLR Group | $2,300,000 |
| 35 | Ennead Architects | $2,282,000 |
| 36 | LPA | $2,205,538 |
| 37 | Becker Morgan Group | $2,200,978 |
| 38 | KZF Design | $2,069,963 |
| 39 | Solomon Cordwell Buenz | $2,000,000 |
| 40 | Little | $1,961,000 |
| 41 | Goodwyn Mills & Cawood | $1,820,095 |
| 42 | Ratio Architects | $1,553,904 |
| 43 | CTA Architects Engineers | $1,353,350 |
| 44 | RNL | $1,306,000 |
| 45 | Rosser International | $1,207,719 |
| 46 | Bergmann Associates | $1,100,000 |
| 47 | Gresham, Smith and Partners | $1,034,930 |
| 48 | Smallwood, Reynolds, Stewart, Stewart & Associates | $1,009,754 |
| 49 | Harvard Jolly Architecture | $964,607 |
| 50 | OZ Architecture | $955,887 |
| 51 | Parkhill, Smith & Cooper | $903,000 |
| 52 | Legat Architects | $899,000 |
| 53 | Shepley Bulfinch | $836,000 |
| 54 | Integrus Architecture | $724,894 |
| 55 | Carrier Johnson + Culture | $700,000 |
| 56 | LS3P | $698,646 |
| 57 | GBBN Architects | $660,000 |
| 58 | Nadel | $650,000 |
| 59 | Eppstein Uhen Architects | $640,751 |
| 60 | Perkins Eastman | $625,000 |
| 61 | Cooper Carry | $623,543 |
| 62 | Swanke Hayden Connell Architects | $588,000 |
| 63 | RTKL Associates | $553,000 |
| 64 | Hastings+Chivetta Architects | $491,188 |
| 65 | Schrader Group Architecture | $448,540 |
| 66 | DesignGroup | $433,190 |
| 67 | Westlake Reed Leskosky | $375,000 |
| 68 | Environetics | $341,475 |
| 69 | VOA Associates | $329,883 |
| 70 | RSP Architects | $322,000 |
| 71 | H3 Hardy Collaboration Architecture | $305,903 |
| 72 | Hnedak Bobo Group | $301,000 |
| 73 | CO Architects | $296,300 |
| 74 | Hoefer Wysocki Architecture | $290,000 |
| 75 | Epstein | $276,000 |
| 76 | NAC|Architecture | $275,930 |
| 77 | Kirksey | $248,926 |
| 78 | NORR | $245,158 |
| 79 | Cuningham Group Architecture | $242,019 |
| 80 | TEG Architects | $231,640 |
| 81 | BRPH | $214,000 |
| 82 | Symmes Maini & McKee Associates | $210,000 |
| 83 | GWWO | $205,236 |
| 84 | Hoffmann Architects | $201,000 |
| 85 | BBS Architects | $200,030 |
| 86 | LawKingdon Architecture | $150,000 |
| 87 | DLA Architects | $133,140 |
| 88 | Good Fulton & Farrell | $132,000 |
| 89 | Baskervill | $130,226 |
| 90 | Flad Architects | $71,820 |
| 91 | Payette | $64,976 |
| 92 | Fanning/Howey Associates | $50,000 |
| 93 | ai Design Group | $33,048 |
| 94 | Commonwealth Architects | $28,586 |
| 95 | Emersion Design | $7,080 |
Top Local Government Sector Engineering Firms
| Rank | Company | 2013 Local Government Revenue |
| 1 | STV | $147,283,000 |
| 2 | Jacobs | $62,297,102 |
| 3 | AECOM Technology Corp. | $54,920,000 |
| 4 | URS Corp. | $23,752,766 |
| 5 | Smith Seckman Reid | $16,715,381 |
| 6 | Arup | $14,169,644 |
| 7 | Parsons Brinckerhoff | $13,307,900 |
| 8 | Syska Hennessy Group | $9,901,246 |
| 9 | Dewberry | $9,071,039 |
| 10 | Simpson Gumpertz & Heger | $7,056,000 |
| 11 | Walker Parking Consultants | $6,800,000 |
| 12 | Shive-Hattery | $5,892,722 |
| 13 | Leidos | $5,512,500 |
| 14 | Joseph R. Loring & Associates | $4,500,000 |
| 15 | Graef | $4,037,835 |
| 16 | KPFF Consulting Engineers | $3,500,000 |
| 17 | TLC Engineering for Architecture | $3,320,414 |
| 18 | WSP Group | $3,000,000 |
| 19 | Coffman Engineers | $2,960,639 |
| 20 | Glumac | $2,196,125 |
| 21 | M/E Engineering | $2,064,517 |
| 22 | Affiliated Engineers | $1,944,000 |
| 23 | Wiss, Janney, Elstner Associates | $1,800,000 |
| 24 | Sparling | $1,770,311 |
| 25 | Ross & Baruzzini | $1,487,622 |
| 26 | TTG | $1,350,000 |
| 27 | Thornton Tomasetti | $1,347,697 |
| 28 | Bridgers & Paxton Consulting Engineers | $1,343,223 |
| 29 | Interface Engineering | $1,263,610 |
| 30 | KJWW Engineering Consultants | $1,214,621 |
| 31 | RDK Engineers | $1,210,000 |
| 32 | Henderson Engineers | $1,194,249 |
| 33 | I. C. Thomasson Associates | $1,100,000 |
| 34 | French & Parrello Associates | $1,036,100 |
| 35 | CTLGroup | $810,000 |
| 36 | GRW | $789,852 |
| 37 | ThermalTech Engineering | $750,000 |
| 38 | Brinjac Engineering | $744,589 |
| 39 | Paulus, Sokolowski and Sartor | $710,000 |
| 40 | Primera Engineers | $662,000 |
| 41 | AKF Group | $533,000 |
| 42 | Barge Waggoner Sumner & Cannon | $515,000 |
| 43 | KCI Technologies | $500,000 |
| 44 | M-E Engineers | $500,000 |
| 45 | H&A Architects & Engineers | $475,000 |
| 46 | Environmental Systems Design | $422,421 |
| 47 | Spectrum Engineers | $415,043 |
| 48 | Vanderweil Engineers | $412,200 |
| 49 | Walter P Moore and Associates | $396,322 |
| 50 | Heapy Engineering | $358,894 |
| 51 | Davis, Bowen & Friedel | $353,571 |
| 52 | KLH Engineers | $320,634 |
| 53 | OLA Consulting Engineers | $262,000 |
| 54 | RMF Engineering | $250,000 |
| 55 | Highland Associates | $250,000 |
| 56 | CJL Engineering | $217,500 |
| 57 | Zak Companies | $208,120 |
| 58 | SSOE Group | $194,443 |
| 59 | Aon Fire Protection Engineering Corp. | $188,253 |
| 60 | Guernsey | $155,150 |
| 61 | Wallace Engineering | $120,000 |
| 62 | Apogee Consulting Group | $118,000 |
| 63 | H.F. Lenz | $100,000 |
| 64 | Rist-Frost-Shumway Engineering | $100,000 |
| 65 | GHT Limited | $100,000 |
| 66 | DeSimone Consulting Engineers | $90,000 |
| 67 | G&W Engineering Corp. | $78,500 |
| 68 | Stanley Consultants | $74,747 |
| 69 | Dunham Associates | $50,000 |
| 70 | Wick Fisher White | $48,530 |
| 71 | Total Building Commissioning | $31,349 |
| 72 | Allen & Shariff | $25,000 |
| 73 | Mazzetti | $12,860 |
Top Local Government Sector Construction Firms
| Rank | Company | 2013 Local Government Revenue |
| 1 | Turner Construction | $1,128,360,449 |
| 2 | Clark Group | $599,476,125 |
| 3 | Walsh Group, The | $489,238,513 |
| 4 | Hensel Phelps | $418,780,000 |
| 5 | Skanska USA | $380,024,542 |
| 6 | PCL Construction | $349,292,097 |
| 7 | Tutor Perini Corp. | $313,279,384 |
| 8 | Balfour Beatty US | $267,605,024 |
| 9 | McCarthy Holdings | $265,000,000 |
| 10 | Brasfield & Gorrie | $197,614,801 |
| 11 | Hunt Construction Group | $188,900,000 |
| 12 | Gilbane | $159,347,000 |
| 13 | STV | $147,283,000 |
| 14 | O'Neil Industries/W.E. O'Neil | $139,280,173 |
| 15 | JE Dunn Construction | $115,362,303 |
| 16 | CORE Construction Group | $81,514,627 |
| 17 | Messer Construction | $65,780,307 |
| 18 | Manhattan Construction | $59,675,022 |
| 19 | Hoffman Construction | $54,190,000 |
| 20 | Shawmut Design and Construction | $49,000,000 |
| 21 | Whiting-Turner Contracting Co., The | $45,840,363 |
| 22 | Heery International | $44,704,482 |
| 23 | HITT Contracting | $43,770,000 |
| 24 | C.W. Driver | $41,380,000 |
| 25 | Flintco | $39,319,870 |
| 26 | Hunt Companies | $32,546,568 |
| 27 | Wight & Company | $32,398,000 |
| 28 | Coakley & Williams Construction | $30,429,072 |
| 29 | Lend Lease | $28,150,000 |
| 30 | Yates Companies, The | $25,400,000 |
| 31 | Walbridge | $23,000,000 |
| 32 | Haselden Construction | $18,578,166 |
| 33 | Consigli Construction | $15,617,383 |
| 34 | Adolfson & Peterson Construction | $15,426,870 |
| 35 | Bernards | $14,000,000 |
| 36 | Parsons Brinckerhoff | $13,307,900 |
| 37 | LeChase Construction Services | $13,120,000 |
| 38 | Layton Construction | $12,800,000 |
| 39 | Kitchell Corp. | $11,821,501 |
| 40 | Hill & Wilkinson | $10,864,000 |
| 41 | New South Construction | $10,361,000 |
| 42 | Bomel Construction | $9,309,000 |
| 43 | Hill International | $9,000,000 |
| 44 | James McHugh Construction | $8,334,048 |
| 45 | W. M. Jordan Company | $7,422,045 |
| 46 | Holder Construction | $7,385,000 |
| 47 | Choate Construction | $6,904,117 |
| 48 | Leopardo Companies | $6,777,423 |
| 49 | Absher Construction | $6,107,896 |
| 50 | Stalco Construction | $5,620,500 |
| 51 | Weitz Company, The | $4,000,000 |
| 52 | Ryan Companies US | $3,057,682 |
| 53 | Kraus-Anderson Construction | $3,000,000 |
| 54 | Structure Tone | $2,998,100 |
| 55 | Sundt Construction | $2,754,904 |
| 56 | Bette Companies, The | $2,697,000 |
| 57 | Batson-Cook | $1,390,120 |
| 58 | Hoar Construction | $1,198,000 |
| 59 | S. M. Wilson & Co. | $1,060,764 |
| 60 | Paric Corp. | $1,000,000 |
| 61 | E.W. Howell | $343,000 |
| 62 | Fortis Construction | $300,000 |
| 63 | BlueScope Construction | $194,507 |
| 64 | KBE Building Corp. | $129,011 |
| 65 | LPCiminelli | $104,118 |
| 66 | IMC Construction | $75,000 |
| 67 | Astorino | $59,002 |
| 68 | Allen & Shariff | $25,000 |
Read BD+C's full 2014 Giants 300 Report
Related Stories
| Sep 13, 2010
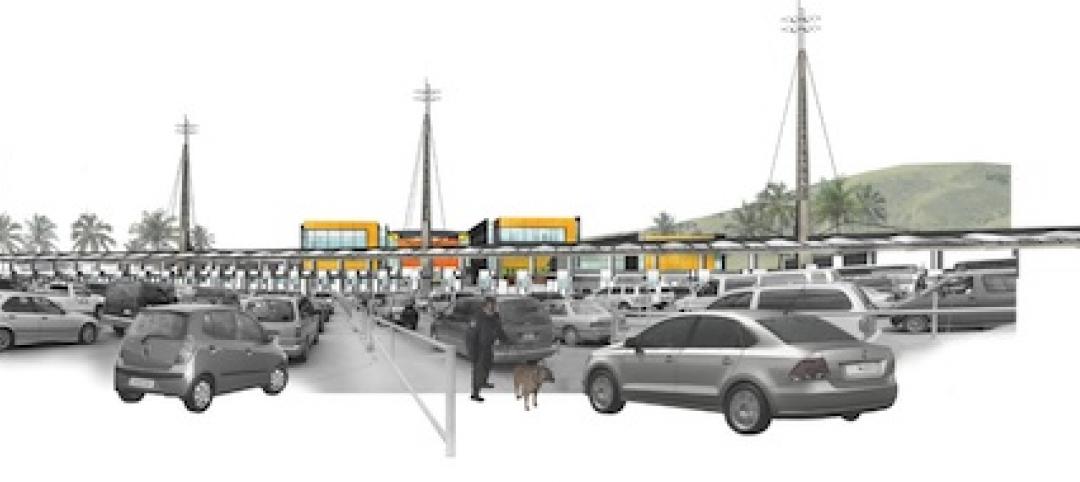
World's busiest land port also to be its greenest
A larger, more efficient, and supergreen border crossing facility is planned for the San Ysidro (Calif.) Port of Entry to better handle the more than 100,000 people who cross the U.S.-Mexico border there each day.

| Sep 13, 2010
Triple-LEED for Engineering Firm's HQ
With more than 250 LEED projects in the works, Enermodal Engineering is Canada's most prolific green building consulting firm. In 2007, with the firm outgrowing its home office in Kitchener, Ont., the decision was made go all out with a new green building. The goal: triple Platinum for New Construction, Commercial Interiors, and Existing Buildings: O&M.

| Sep 13, 2010
Stadium Scores Big with Cowboys' Fans
Jerry Jones, controversial billionaire owner of the Dallas Cowboys, wanted the team's new stadium in Arlington, Texas, to really amp up the fan experience. The organization spent $1.2 billion building a massive three-million-sf arena that seats 80,000 (with room for another 20,000) and has more than 300 private suites, some at field level-a first for an NFL stadium.

| Sep 13, 2010
'A Model for the Entire Industry'
How a university and its Building Team forged a relationship with 'the toughest building authority in the country' to bring a replacement hospital in early and under budget.
| Sep 13, 2010
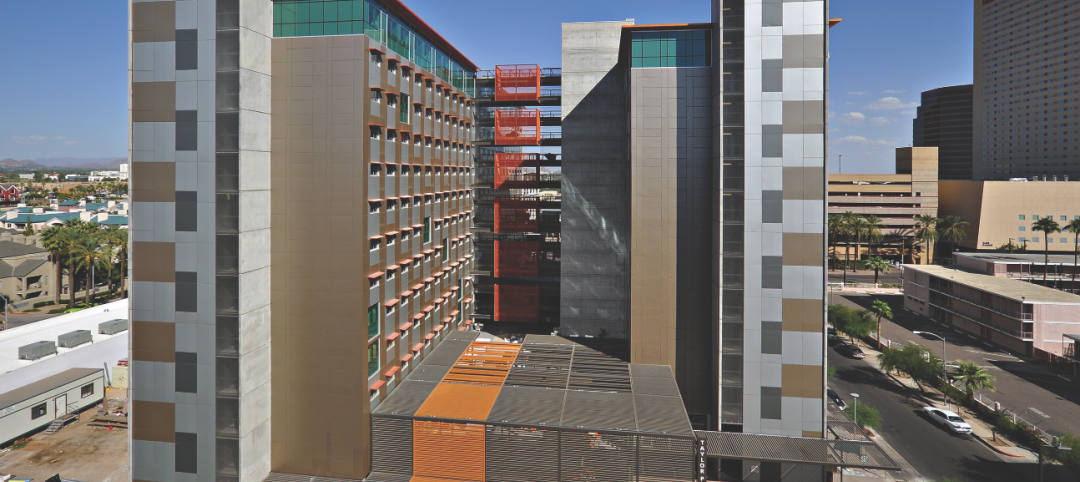
Committed to the Core
How a forward-looking city government, a growth-minded university, a developer with vision, and a determined Building Team are breathing life into downtown Phoenix.
| Sep 13, 2010
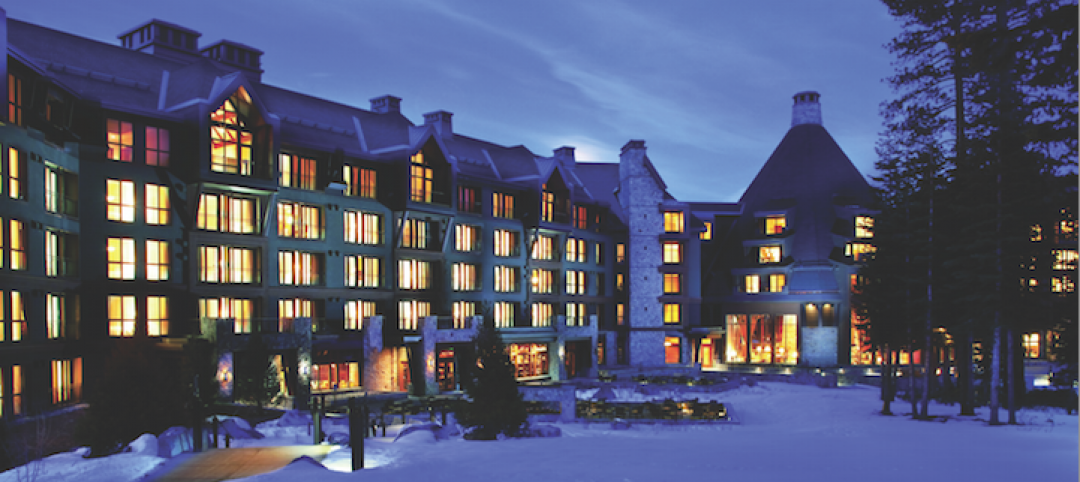
Conquering a Mountain of Construction Challenges
Brutal winter weather, shortages of materials, escalating costs, occasional visits from the local bear population-all these were joys this Building Team experienced working a new resort high up in the Sierra Nevada.

| Sep 13, 2010
Data Centers Keeping Energy, Security in Check
Power consumption for data centers doubled from 2000 and 2006, and it is anticipated to double again by 2011, making these mission-critical facilities the nation's largest commercial user of electric power. With major technology companies investing heavily in new data centers, it's no wonder Building Teams see these mission-critical facilities as a golden opportunity, and why they are working hard to keep energy costs at data centers in check.

| Sep 13, 2010
3D Prototyping Goes Low-cost
Today’s less costly 3D color printers are attracting the attention of AEC firms looking to rapidly prototype designs and communicate design intent to clients.
| Aug 11, 2010
Cubellis principals reorganize as CI design
Former principals of Cubellis Inc. have formed ci design "with a stellar group of projects in the United States and internationally," states John Larsen who, with Richard Rankin and Christopher Ladd, is leading the architecture and planning firm.
| Aug 11, 2010
Leo A Daly changes name of STH, completes acquisition
LEO A DALY has changed the name of STH Architectural Group to the name of its parent company, Leo A Daly. STH was acquired in February 2009 as a strategic move to accelerate growth in its core business sectors and to strengthen the firm's presence in the Florida market.


