

 Fire Station #4. Photo: courtesy HDR")
Top Local Government Sector Architecture Firms
| Rank | Company | 2013 Local Government Revenue |
| 1 | HOK | $55,452,267 |
| 2 | Stantec | $49,405,105 |
| 3 | Heery International | $44,704,482 |
| 4 | SHW Group | $40,016,000 |
| 5 | FreemanWhite | $25,833,487 |
| 6 | Moseley Architects | $20,046,498 |
| 7 | Skidmore, Owings & Merrill | $19,897,809 |
| 8 | PGAL | $15,361,017 |
| 9 | SmithGroupJJR | $14,348,220 |
| 10 | Quattrocchi Kwok Architects | $13,230,000 |
| 11 | Gensler | $13,040,471 |
| 12 | RS&H | $12,250,000 |
| 13 | BLDD Architects | $11,800,000 |
| 14 | Perkins+will | $9,226,704 |
| 15 | Clark Nexsen | $8,809,308 |
| 16 | HNTB Corp. | $8,423,750 |
| 17 | HKS | $6,837,590 |
| 18 | SchenkelShultz Architecture | $6,469,000 |
| 19 | Fentress Architects | $6,419,230 |
| 20 | LMN Architects | $6,195,600 |
| 21 | HDR | $6,188,900 |
| 22 | NBBJ | $6,034,000 |
| 23 | HMC Architects | $5,693,289 |
| 24 | LaBella Associates | $5,095,000 |
| 25 | ZGF Architects | $4,706,985 |
| 26 | Harley Ellis Devereaux | $4,310,000 |
| 27 | Hammel, Green and Abrahamson | $4,156,642 |
| 28 | FGM Architects | $3,625,486 |
| 29 | Leo A Daly | $3,577,658 |
| 30 | Wight & Company | $3,219,000 |
| 31 | Morris Architects | $2,700,000 |
| 32 | Page | $2,522,000 |
| 33 | Beyer Blinder Belle | $2,433,253 |
| 34 | DLR Group | $2,300,000 |
| 35 | Ennead Architects | $2,282,000 |
| 36 | LPA | $2,205,538 |
| 37 | Becker Morgan Group | $2,200,978 |
| 38 | KZF Design | $2,069,963 |
| 39 | Solomon Cordwell Buenz | $2,000,000 |
| 40 | Little | $1,961,000 |
| 41 | Goodwyn Mills & Cawood | $1,820,095 |
| 42 | Ratio Architects | $1,553,904 |
| 43 | CTA Architects Engineers | $1,353,350 |
| 44 | RNL | $1,306,000 |
| 45 | Rosser International | $1,207,719 |
| 46 | Bergmann Associates | $1,100,000 |
| 47 | Gresham, Smith and Partners | $1,034,930 |
| 48 | Smallwood, Reynolds, Stewart, Stewart & Associates | $1,009,754 |
| 49 | Harvard Jolly Architecture | $964,607 |
| 50 | OZ Architecture | $955,887 |
| 51 | Parkhill, Smith & Cooper | $903,000 |
| 52 | Legat Architects | $899,000 |
| 53 | Shepley Bulfinch | $836,000 |
| 54 | Integrus Architecture | $724,894 |
| 55 | Carrier Johnson + Culture | $700,000 |
| 56 | LS3P | $698,646 |
| 57 | GBBN Architects | $660,000 |
| 58 | Nadel | $650,000 |
| 59 | Eppstein Uhen Architects | $640,751 |
| 60 | Perkins Eastman | $625,000 |
| 61 | Cooper Carry | $623,543 |
| 62 | Swanke Hayden Connell Architects | $588,000 |
| 63 | RTKL Associates | $553,000 |
| 64 | Hastings+Chivetta Architects | $491,188 |
| 65 | Schrader Group Architecture | $448,540 |
| 66 | DesignGroup | $433,190 |
| 67 | Westlake Reed Leskosky | $375,000 |
| 68 | Environetics | $341,475 |
| 69 | VOA Associates | $329,883 |
| 70 | RSP Architects | $322,000 |
| 71 | H3 Hardy Collaboration Architecture | $305,903 |
| 72 | Hnedak Bobo Group | $301,000 |
| 73 | CO Architects | $296,300 |
| 74 | Hoefer Wysocki Architecture | $290,000 |
| 75 | Epstein | $276,000 |
| 76 | NAC|Architecture | $275,930 |
| 77 | Kirksey | $248,926 |
| 78 | NORR | $245,158 |
| 79 | Cuningham Group Architecture | $242,019 |
| 80 | TEG Architects | $231,640 |
| 81 | BRPH | $214,000 |
| 82 | Symmes Maini & McKee Associates | $210,000 |
| 83 | GWWO | $205,236 |
| 84 | Hoffmann Architects | $201,000 |
| 85 | BBS Architects | $200,030 |
| 86 | LawKingdon Architecture | $150,000 |
| 87 | DLA Architects | $133,140 |
| 88 | Good Fulton & Farrell | $132,000 |
| 89 | Baskervill | $130,226 |
| 90 | Flad Architects | $71,820 |
| 91 | Payette | $64,976 |
| 92 | Fanning/Howey Associates | $50,000 |
| 93 | ai Design Group | $33,048 |
| 94 | Commonwealth Architects | $28,586 |
| 95 | Emersion Design | $7,080 |
Top Local Government Sector Engineering Firms
| Rank | Company | 2013 Local Government Revenue |
| 1 | STV | $147,283,000 |
| 2 | Jacobs | $62,297,102 |
| 3 | AECOM Technology Corp. | $54,920,000 |
| 4 | URS Corp. | $23,752,766 |
| 5 | Smith Seckman Reid | $16,715,381 |
| 6 | Arup | $14,169,644 |
| 7 | Parsons Brinckerhoff | $13,307,900 |
| 8 | Syska Hennessy Group | $9,901,246 |
| 9 | Dewberry | $9,071,039 |
| 10 | Simpson Gumpertz & Heger | $7,056,000 |
| 11 | Walker Parking Consultants | $6,800,000 |
| 12 | Shive-Hattery | $5,892,722 |
| 13 | Leidos | $5,512,500 |
| 14 | Joseph R. Loring & Associates | $4,500,000 |
| 15 | Graef | $4,037,835 |
| 16 | KPFF Consulting Engineers | $3,500,000 |
| 17 | TLC Engineering for Architecture | $3,320,414 |
| 18 | WSP Group | $3,000,000 |
| 19 | Coffman Engineers | $2,960,639 |
| 20 | Glumac | $2,196,125 |
| 21 | M/E Engineering | $2,064,517 |
| 22 | Affiliated Engineers | $1,944,000 |
| 23 | Wiss, Janney, Elstner Associates | $1,800,000 |
| 24 | Sparling | $1,770,311 |
| 25 | Ross & Baruzzini | $1,487,622 |
| 26 | TTG | $1,350,000 |
| 27 | Thornton Tomasetti | $1,347,697 |
| 28 | Bridgers & Paxton Consulting Engineers | $1,343,223 |
| 29 | Interface Engineering | $1,263,610 |
| 30 | KJWW Engineering Consultants | $1,214,621 |
| 31 | RDK Engineers | $1,210,000 |
| 32 | Henderson Engineers | $1,194,249 |
| 33 | I. C. Thomasson Associates | $1,100,000 |
| 34 | French & Parrello Associates | $1,036,100 |
| 35 | CTLGroup | $810,000 |
| 36 | GRW | $789,852 |
| 37 | ThermalTech Engineering | $750,000 |
| 38 | Brinjac Engineering | $744,589 |
| 39 | Paulus, Sokolowski and Sartor | $710,000 |
| 40 | Primera Engineers | $662,000 |
| 41 | AKF Group | $533,000 |
| 42 | Barge Waggoner Sumner & Cannon | $515,000 |
| 43 | KCI Technologies | $500,000 |
| 44 | M-E Engineers | $500,000 |
| 45 | H&A Architects & Engineers | $475,000 |
| 46 | Environmental Systems Design | $422,421 |
| 47 | Spectrum Engineers | $415,043 |
| 48 | Vanderweil Engineers | $412,200 |
| 49 | Walter P Moore and Associates | $396,322 |
| 50 | Heapy Engineering | $358,894 |
| 51 | Davis, Bowen & Friedel | $353,571 |
| 52 | KLH Engineers | $320,634 |
| 53 | OLA Consulting Engineers | $262,000 |
| 54 | RMF Engineering | $250,000 |
| 55 | Highland Associates | $250,000 |
| 56 | CJL Engineering | $217,500 |
| 57 | Zak Companies | $208,120 |
| 58 | SSOE Group | $194,443 |
| 59 | Aon Fire Protection Engineering Corp. | $188,253 |
| 60 | Guernsey | $155,150 |
| 61 | Wallace Engineering | $120,000 |
| 62 | Apogee Consulting Group | $118,000 |
| 63 | H.F. Lenz | $100,000 |
| 64 | Rist-Frost-Shumway Engineering | $100,000 |
| 65 | GHT Limited | $100,000 |
| 66 | DeSimone Consulting Engineers | $90,000 |
| 67 | G&W Engineering Corp. | $78,500 |
| 68 | Stanley Consultants | $74,747 |
| 69 | Dunham Associates | $50,000 |
| 70 | Wick Fisher White | $48,530 |
| 71 | Total Building Commissioning | $31,349 |
| 72 | Allen & Shariff | $25,000 |
| 73 | Mazzetti | $12,860 |
Top Local Government Sector Construction Firms
| Rank | Company | 2013 Local Government Revenue |
| 1 | Turner Construction | $1,128,360,449 |
| 2 | Clark Group | $599,476,125 |
| 3 | Walsh Group, The | $489,238,513 |
| 4 | Hensel Phelps | $418,780,000 |
| 5 | Skanska USA | $380,024,542 |
| 6 | PCL Construction | $349,292,097 |
| 7 | Tutor Perini Corp. | $313,279,384 |
| 8 | Balfour Beatty US | $267,605,024 |
| 9 | McCarthy Holdings | $265,000,000 |
| 10 | Brasfield & Gorrie | $197,614,801 |
| 11 | Hunt Construction Group | $188,900,000 |
| 12 | Gilbane | $159,347,000 |
| 13 | STV | $147,283,000 |
| 14 | O'Neil Industries/W.E. O'Neil | $139,280,173 |
| 15 | JE Dunn Construction | $115,362,303 |
| 16 | CORE Construction Group | $81,514,627 |
| 17 | Messer Construction | $65,780,307 |
| 18 | Manhattan Construction | $59,675,022 |
| 19 | Hoffman Construction | $54,190,000 |
| 20 | Shawmut Design and Construction | $49,000,000 |
| 21 | Whiting-Turner Contracting Co., The | $45,840,363 |
| 22 | Heery International | $44,704,482 |
| 23 | HITT Contracting | $43,770,000 |
| 24 | C.W. Driver | $41,380,000 |
| 25 | Flintco | $39,319,870 |
| 26 | Hunt Companies | $32,546,568 |
| 27 | Wight & Company | $32,398,000 |
| 28 | Coakley & Williams Construction | $30,429,072 |
| 29 | Lend Lease | $28,150,000 |
| 30 | Yates Companies, The | $25,400,000 |
| 31 | Walbridge | $23,000,000 |
| 32 | Haselden Construction | $18,578,166 |
| 33 | Consigli Construction | $15,617,383 |
| 34 | Adolfson & Peterson Construction | $15,426,870 |
| 35 | Bernards | $14,000,000 |
| 36 | Parsons Brinckerhoff | $13,307,900 |
| 37 | LeChase Construction Services | $13,120,000 |
| 38 | Layton Construction | $12,800,000 |
| 39 | Kitchell Corp. | $11,821,501 |
| 40 | Hill & Wilkinson | $10,864,000 |
| 41 | New South Construction | $10,361,000 |
| 42 | Bomel Construction | $9,309,000 |
| 43 | Hill International | $9,000,000 |
| 44 | James McHugh Construction | $8,334,048 |
| 45 | W. M. Jordan Company | $7,422,045 |
| 46 | Holder Construction | $7,385,000 |
| 47 | Choate Construction | $6,904,117 |
| 48 | Leopardo Companies | $6,777,423 |
| 49 | Absher Construction | $6,107,896 |
| 50 | Stalco Construction | $5,620,500 |
| 51 | Weitz Company, The | $4,000,000 |
| 52 | Ryan Companies US | $3,057,682 |
| 53 | Kraus-Anderson Construction | $3,000,000 |
| 54 | Structure Tone | $2,998,100 |
| 55 | Sundt Construction | $2,754,904 |
| 56 | Bette Companies, The | $2,697,000 |
| 57 | Batson-Cook | $1,390,120 |
| 58 | Hoar Construction | $1,198,000 |
| 59 | S. M. Wilson & Co. | $1,060,764 |
| 60 | Paric Corp. | $1,000,000 |
| 61 | E.W. Howell | $343,000 |
| 62 | Fortis Construction | $300,000 |
| 63 | BlueScope Construction | $194,507 |
| 64 | KBE Building Corp. | $129,011 |
| 65 | LPCiminelli | $104,118 |
| 66 | IMC Construction | $75,000 |
| 67 | Astorino | $59,002 |
| 68 | Allen & Shariff | $25,000 |
Read BD+C's full 2014 Giants 300 Report
Related Stories
| Sep 22, 2010
Satellier, Potential + Semac close investment deal
Satellier, a world leader in providing CAD and Building Information Modeling (BIM) outsourced services to the architecture, engineering and construction industry, announces a strategic minority investment from India-based top engineering firm Potential + Semac, ushering in the next evolution of the global architecture support industry.
| Sep 21, 2010
New BOMA-Kingsley Report Shows Compression in Utilities and Total Operating Expenses
A new report from the Building Owners and Managers Association (BOMA) International and Kingsley Associates shows that property professionals are trimming building operating expenses to stay competitive in today’s challenging marketplace. The report, which analyzes data from BOMA International’s 2010 Experience Exchange Report® (EER), revealed a $0.09 (1.1 percent) decrease in total operating expenses for U.S. private-sector buildings during 2009.
| Sep 21, 2010
Forecast: Existing buildings to earn 50% of green building certifications
A new report from Pike Research forecasts that by 2020, nearly half the green building certifications will be for existing buildings—accounting for 25 billion sf. The study, “Green Building Certification Programs,” analyzed current market and regulatory conditions related to green building certification programs, and found that green building remain robust during the recession and that certifications for existing buildings are an increasing area of focus.
| Sep 21, 2010
Middough Inc. Celebrates its 60th Anniversary
Middough Inc., a top ranking U.S. architectural, engineering and management services company, announces the celebration of its 60th anniversary, says President and CEO, Ronald R. Ledin, PE.

| Sep 16, 2010
Gehry’s Santa Monica Place gets a wave of changes
Omniplan, in association with Jerde Partnership, created an updated design for Santa Monica Place, a shopping mall designed by Frank Gehry in 1980.
| Sep 16, 2010
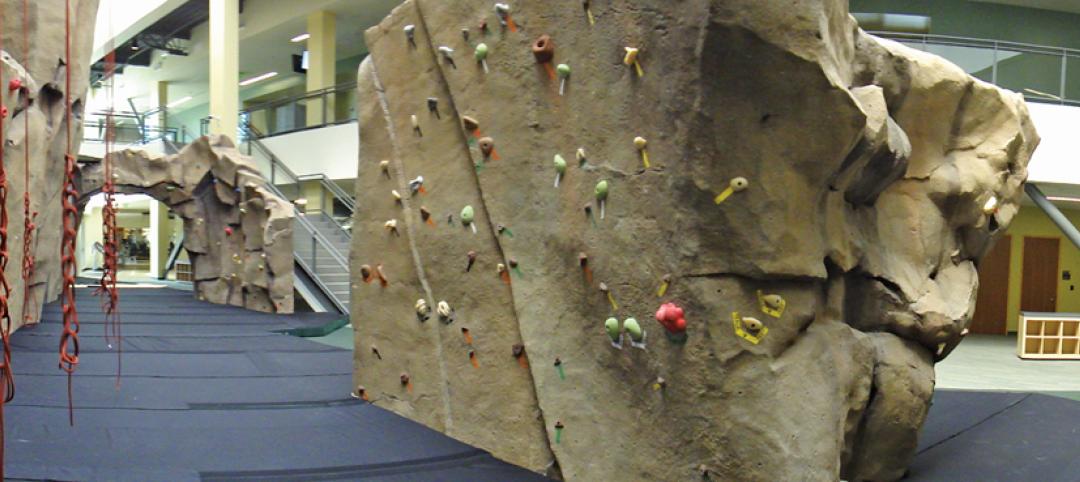
Green recreation/wellness center targets physical, environmental health
The 151,000-sf recreation and wellness center at California State University’s Sacramento campus, called the WELL (for “wellness, education, leisure, lifestyle”), has a fitness center, café, indoor track, gymnasium, racquetball courts, educational and counseling space, the largest rock climbing wall in the CSU system.
| Sep 13, 2010
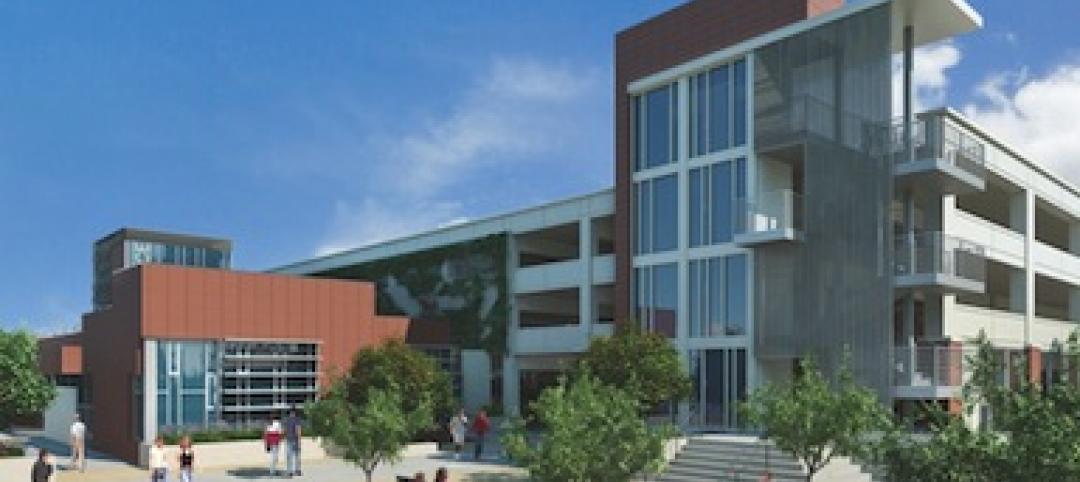
Community college police, parking structure targets LEED Platinum
The San Diego Community College District's $1.555 billion construction program continues with groundbreaking for a 6,000-sf police substation and an 828-space, four-story parking structure at San Diego Miramar College.
| Sep 13, 2010
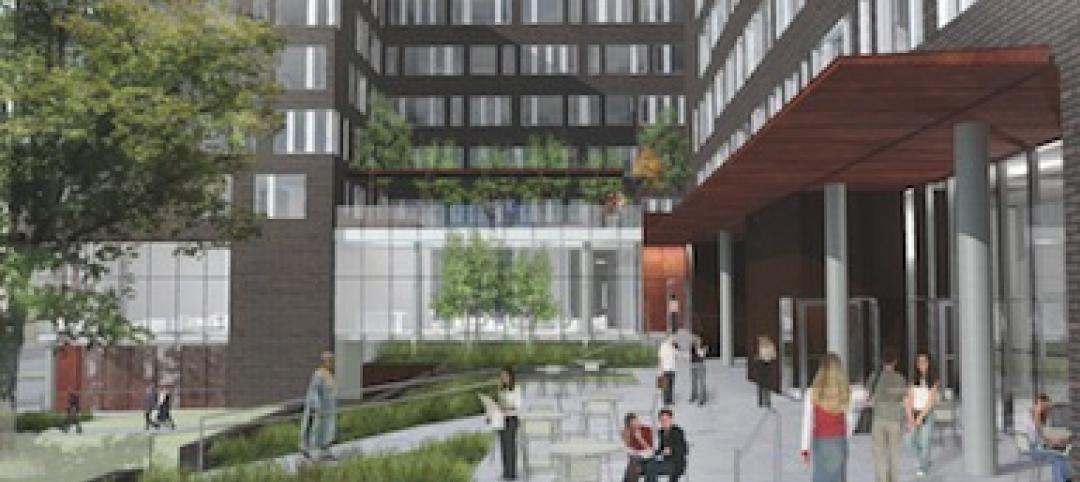
Campus housing fosters community connection
A 600,000-sf complex on the University of Washington's Seattle campus will include four residence halls for 1,650 students and a 100-seat cafe, 8,000-sf grocery store, and conference center with 200-seat auditorium for both student and community use.


