

 Fire Station #4. Photo: courtesy HDR")
Top Local Government Sector Architecture Firms
| Rank | Company | 2013 Local Government Revenue |
| 1 | HOK | $55,452,267 |
| 2 | Stantec | $49,405,105 |
| 3 | Heery International | $44,704,482 |
| 4 | SHW Group | $40,016,000 |
| 5 | FreemanWhite | $25,833,487 |
| 6 | Moseley Architects | $20,046,498 |
| 7 | Skidmore, Owings & Merrill | $19,897,809 |
| 8 | PGAL | $15,361,017 |
| 9 | SmithGroupJJR | $14,348,220 |
| 10 | Quattrocchi Kwok Architects | $13,230,000 |
| 11 | Gensler | $13,040,471 |
| 12 | RS&H | $12,250,000 |
| 13 | BLDD Architects | $11,800,000 |
| 14 | Perkins+will | $9,226,704 |
| 15 | Clark Nexsen | $8,809,308 |
| 16 | HNTB Corp. | $8,423,750 |
| 17 | HKS | $6,837,590 |
| 18 | SchenkelShultz Architecture | $6,469,000 |
| 19 | Fentress Architects | $6,419,230 |
| 20 | LMN Architects | $6,195,600 |
| 21 | HDR | $6,188,900 |
| 22 | NBBJ | $6,034,000 |
| 23 | HMC Architects | $5,693,289 |
| 24 | LaBella Associates | $5,095,000 |
| 25 | ZGF Architects | $4,706,985 |
| 26 | Harley Ellis Devereaux | $4,310,000 |
| 27 | Hammel, Green and Abrahamson | $4,156,642 |
| 28 | FGM Architects | $3,625,486 |
| 29 | Leo A Daly | $3,577,658 |
| 30 | Wight & Company | $3,219,000 |
| 31 | Morris Architects | $2,700,000 |
| 32 | Page | $2,522,000 |
| 33 | Beyer Blinder Belle | $2,433,253 |
| 34 | DLR Group | $2,300,000 |
| 35 | Ennead Architects | $2,282,000 |
| 36 | LPA | $2,205,538 |
| 37 | Becker Morgan Group | $2,200,978 |
| 38 | KZF Design | $2,069,963 |
| 39 | Solomon Cordwell Buenz | $2,000,000 |
| 40 | Little | $1,961,000 |
| 41 | Goodwyn Mills & Cawood | $1,820,095 |
| 42 | Ratio Architects | $1,553,904 |
| 43 | CTA Architects Engineers | $1,353,350 |
| 44 | RNL | $1,306,000 |
| 45 | Rosser International | $1,207,719 |
| 46 | Bergmann Associates | $1,100,000 |
| 47 | Gresham, Smith and Partners | $1,034,930 |
| 48 | Smallwood, Reynolds, Stewart, Stewart & Associates | $1,009,754 |
| 49 | Harvard Jolly Architecture | $964,607 |
| 50 | OZ Architecture | $955,887 |
| 51 | Parkhill, Smith & Cooper | $903,000 |
| 52 | Legat Architects | $899,000 |
| 53 | Shepley Bulfinch | $836,000 |
| 54 | Integrus Architecture | $724,894 |
| 55 | Carrier Johnson + Culture | $700,000 |
| 56 | LS3P | $698,646 |
| 57 | GBBN Architects | $660,000 |
| 58 | Nadel | $650,000 |
| 59 | Eppstein Uhen Architects | $640,751 |
| 60 | Perkins Eastman | $625,000 |
| 61 | Cooper Carry | $623,543 |
| 62 | Swanke Hayden Connell Architects | $588,000 |
| 63 | RTKL Associates | $553,000 |
| 64 | Hastings+Chivetta Architects | $491,188 |
| 65 | Schrader Group Architecture | $448,540 |
| 66 | DesignGroup | $433,190 |
| 67 | Westlake Reed Leskosky | $375,000 |
| 68 | Environetics | $341,475 |
| 69 | VOA Associates | $329,883 |
| 70 | RSP Architects | $322,000 |
| 71 | H3 Hardy Collaboration Architecture | $305,903 |
| 72 | Hnedak Bobo Group | $301,000 |
| 73 | CO Architects | $296,300 |
| 74 | Hoefer Wysocki Architecture | $290,000 |
| 75 | Epstein | $276,000 |
| 76 | NAC|Architecture | $275,930 |
| 77 | Kirksey | $248,926 |
| 78 | NORR | $245,158 |
| 79 | Cuningham Group Architecture | $242,019 |
| 80 | TEG Architects | $231,640 |
| 81 | BRPH | $214,000 |
| 82 | Symmes Maini & McKee Associates | $210,000 |
| 83 | GWWO | $205,236 |
| 84 | Hoffmann Architects | $201,000 |
| 85 | BBS Architects | $200,030 |
| 86 | LawKingdon Architecture | $150,000 |
| 87 | DLA Architects | $133,140 |
| 88 | Good Fulton & Farrell | $132,000 |
| 89 | Baskervill | $130,226 |
| 90 | Flad Architects | $71,820 |
| 91 | Payette | $64,976 |
| 92 | Fanning/Howey Associates | $50,000 |
| 93 | ai Design Group | $33,048 |
| 94 | Commonwealth Architects | $28,586 |
| 95 | Emersion Design | $7,080 |
Top Local Government Sector Engineering Firms
| Rank | Company | 2013 Local Government Revenue |
| 1 | STV | $147,283,000 |
| 2 | Jacobs | $62,297,102 |
| 3 | AECOM Technology Corp. | $54,920,000 |
| 4 | URS Corp. | $23,752,766 |
| 5 | Smith Seckman Reid | $16,715,381 |
| 6 | Arup | $14,169,644 |
| 7 | Parsons Brinckerhoff | $13,307,900 |
| 8 | Syska Hennessy Group | $9,901,246 |
| 9 | Dewberry | $9,071,039 |
| 10 | Simpson Gumpertz & Heger | $7,056,000 |
| 11 | Walker Parking Consultants | $6,800,000 |
| 12 | Shive-Hattery | $5,892,722 |
| 13 | Leidos | $5,512,500 |
| 14 | Joseph R. Loring & Associates | $4,500,000 |
| 15 | Graef | $4,037,835 |
| 16 | KPFF Consulting Engineers | $3,500,000 |
| 17 | TLC Engineering for Architecture | $3,320,414 |
| 18 | WSP Group | $3,000,000 |
| 19 | Coffman Engineers | $2,960,639 |
| 20 | Glumac | $2,196,125 |
| 21 | M/E Engineering | $2,064,517 |
| 22 | Affiliated Engineers | $1,944,000 |
| 23 | Wiss, Janney, Elstner Associates | $1,800,000 |
| 24 | Sparling | $1,770,311 |
| 25 | Ross & Baruzzini | $1,487,622 |
| 26 | TTG | $1,350,000 |
| 27 | Thornton Tomasetti | $1,347,697 |
| 28 | Bridgers & Paxton Consulting Engineers | $1,343,223 |
| 29 | Interface Engineering | $1,263,610 |
| 30 | KJWW Engineering Consultants | $1,214,621 |
| 31 | RDK Engineers | $1,210,000 |
| 32 | Henderson Engineers | $1,194,249 |
| 33 | I. C. Thomasson Associates | $1,100,000 |
| 34 | French & Parrello Associates | $1,036,100 |
| 35 | CTLGroup | $810,000 |
| 36 | GRW | $789,852 |
| 37 | ThermalTech Engineering | $750,000 |
| 38 | Brinjac Engineering | $744,589 |
| 39 | Paulus, Sokolowski and Sartor | $710,000 |
| 40 | Primera Engineers | $662,000 |
| 41 | AKF Group | $533,000 |
| 42 | Barge Waggoner Sumner & Cannon | $515,000 |
| 43 | KCI Technologies | $500,000 |
| 44 | M-E Engineers | $500,000 |
| 45 | H&A Architects & Engineers | $475,000 |
| 46 | Environmental Systems Design | $422,421 |
| 47 | Spectrum Engineers | $415,043 |
| 48 | Vanderweil Engineers | $412,200 |
| 49 | Walter P Moore and Associates | $396,322 |
| 50 | Heapy Engineering | $358,894 |
| 51 | Davis, Bowen & Friedel | $353,571 |
| 52 | KLH Engineers | $320,634 |
| 53 | OLA Consulting Engineers | $262,000 |
| 54 | RMF Engineering | $250,000 |
| 55 | Highland Associates | $250,000 |
| 56 | CJL Engineering | $217,500 |
| 57 | Zak Companies | $208,120 |
| 58 | SSOE Group | $194,443 |
| 59 | Aon Fire Protection Engineering Corp. | $188,253 |
| 60 | Guernsey | $155,150 |
| 61 | Wallace Engineering | $120,000 |
| 62 | Apogee Consulting Group | $118,000 |
| 63 | H.F. Lenz | $100,000 |
| 64 | Rist-Frost-Shumway Engineering | $100,000 |
| 65 | GHT Limited | $100,000 |
| 66 | DeSimone Consulting Engineers | $90,000 |
| 67 | G&W Engineering Corp. | $78,500 |
| 68 | Stanley Consultants | $74,747 |
| 69 | Dunham Associates | $50,000 |
| 70 | Wick Fisher White | $48,530 |
| 71 | Total Building Commissioning | $31,349 |
| 72 | Allen & Shariff | $25,000 |
| 73 | Mazzetti | $12,860 |
Top Local Government Sector Construction Firms
| Rank | Company | 2013 Local Government Revenue |
| 1 | Turner Construction | $1,128,360,449 |
| 2 | Clark Group | $599,476,125 |
| 3 | Walsh Group, The | $489,238,513 |
| 4 | Hensel Phelps | $418,780,000 |
| 5 | Skanska USA | $380,024,542 |
| 6 | PCL Construction | $349,292,097 |
| 7 | Tutor Perini Corp. | $313,279,384 |
| 8 | Balfour Beatty US | $267,605,024 |
| 9 | McCarthy Holdings | $265,000,000 |
| 10 | Brasfield & Gorrie | $197,614,801 |
| 11 | Hunt Construction Group | $188,900,000 |
| 12 | Gilbane | $159,347,000 |
| 13 | STV | $147,283,000 |
| 14 | O'Neil Industries/W.E. O'Neil | $139,280,173 |
| 15 | JE Dunn Construction | $115,362,303 |
| 16 | CORE Construction Group | $81,514,627 |
| 17 | Messer Construction | $65,780,307 |
| 18 | Manhattan Construction | $59,675,022 |
| 19 | Hoffman Construction | $54,190,000 |
| 20 | Shawmut Design and Construction | $49,000,000 |
| 21 | Whiting-Turner Contracting Co., The | $45,840,363 |
| 22 | Heery International | $44,704,482 |
| 23 | HITT Contracting | $43,770,000 |
| 24 | C.W. Driver | $41,380,000 |
| 25 | Flintco | $39,319,870 |
| 26 | Hunt Companies | $32,546,568 |
| 27 | Wight & Company | $32,398,000 |
| 28 | Coakley & Williams Construction | $30,429,072 |
| 29 | Lend Lease | $28,150,000 |
| 30 | Yates Companies, The | $25,400,000 |
| 31 | Walbridge | $23,000,000 |
| 32 | Haselden Construction | $18,578,166 |
| 33 | Consigli Construction | $15,617,383 |
| 34 | Adolfson & Peterson Construction | $15,426,870 |
| 35 | Bernards | $14,000,000 |
| 36 | Parsons Brinckerhoff | $13,307,900 |
| 37 | LeChase Construction Services | $13,120,000 |
| 38 | Layton Construction | $12,800,000 |
| 39 | Kitchell Corp. | $11,821,501 |
| 40 | Hill & Wilkinson | $10,864,000 |
| 41 | New South Construction | $10,361,000 |
| 42 | Bomel Construction | $9,309,000 |
| 43 | Hill International | $9,000,000 |
| 44 | James McHugh Construction | $8,334,048 |
| 45 | W. M. Jordan Company | $7,422,045 |
| 46 | Holder Construction | $7,385,000 |
| 47 | Choate Construction | $6,904,117 |
| 48 | Leopardo Companies | $6,777,423 |
| 49 | Absher Construction | $6,107,896 |
| 50 | Stalco Construction | $5,620,500 |
| 51 | Weitz Company, The | $4,000,000 |
| 52 | Ryan Companies US | $3,057,682 |
| 53 | Kraus-Anderson Construction | $3,000,000 |
| 54 | Structure Tone | $2,998,100 |
| 55 | Sundt Construction | $2,754,904 |
| 56 | Bette Companies, The | $2,697,000 |
| 57 | Batson-Cook | $1,390,120 |
| 58 | Hoar Construction | $1,198,000 |
| 59 | S. M. Wilson & Co. | $1,060,764 |
| 60 | Paric Corp. | $1,000,000 |
| 61 | E.W. Howell | $343,000 |
| 62 | Fortis Construction | $300,000 |
| 63 | BlueScope Construction | $194,507 |
| 64 | KBE Building Corp. | $129,011 |
| 65 | LPCiminelli | $104,118 |
| 66 | IMC Construction | $75,000 |
| 67 | Astorino | $59,002 |
| 68 | Allen & Shariff | $25,000 |
Read BD+C's full 2014 Giants 300 Report
Related Stories

| Nov 22, 2013
Kieran Timberlake, PE International develop BIM tool for green building life cycle assessment
Kieran Timberlake and PE International have developed Tally, an analysis tool to help BIM users keep better score of their projects’ complete environmental footprints.

| Nov 20, 2013
Architecture Billings Index slows in October; project inquiries stay strong
Following three months of accelerating demand for design services, the Architecture Billings Index reflected a somewhat slower pace of growth in October. The October ABI score was 51.6, down from a mark of 54.3 in September.

| Nov 19, 2013
Pediatric design in an adult hospital setting
Freestanding pediatric facilities have operational and physical characteristics that differ from those of adult facilities.

| Nov 18, 2013
6 checkpoints when designing a pediatric healthcare unit
As more time and money is devoted to neonatal and pediatric research, evidence-based design is playing an increasingly crucial role in the development of healthcare facilities for children. Here are six important factors AEC firms should consider when designing pediatric healthcare facilities.

| Nov 18, 2013
Lord Aeck Sargent opens metro D.C. office, updates brand
Architecture, design, and planning firm unveils its sixth office, plus a new visual identity system and website

| Nov 18, 2013
How do construction professionals use social media?
LinkedIn is the social network used by most construction professionals, according to the results of a newly released national survey conducted by the Construction Marketing Association.

| Nov 17, 2013
How to spend your first 15 minutes with a prospect
Every business development person has been there. You’ve finally earned a few minutes to impress a prospect that you’ve been pursuing. This is your opportunity to shine. What do you say?
| Nov 17, 2013
Meet up with the BD+C team at Greenbuild. Drinks are on us!
To all our friends in the AEC industry, you are cordially invited to join the BD+C team at several fun events during the Greenbuild show this week. No RSVP required. Just show up and enjoy.

| Nov 15, 2013
Halls of ivy keep getting greener and greener
Academic institutions have been testing the limits of energy-conserving technologies, devising new ways to pay for sustainability extras, and extending sustainability to the whole campus.

| Nov 15, 2013
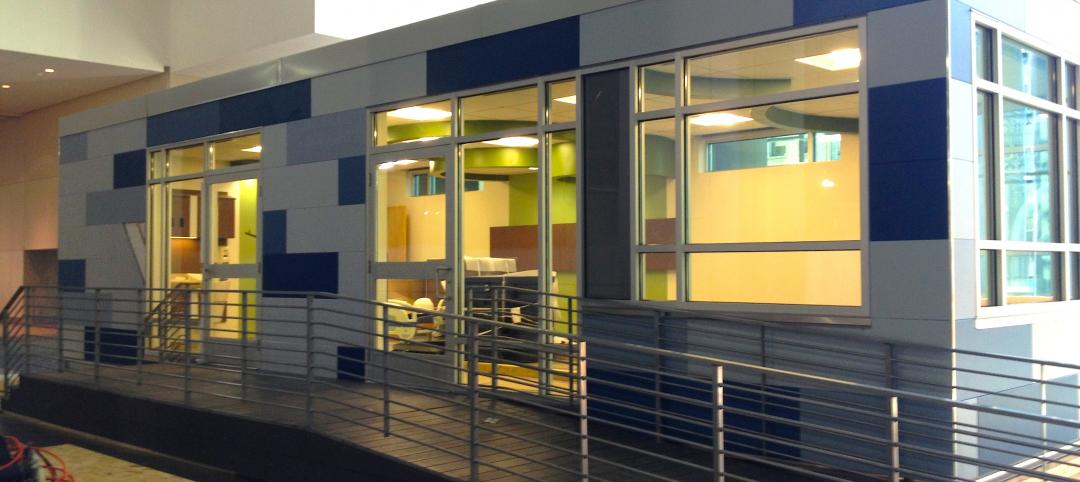
Pedia-Pod: A state-of-the-art pediatric building module
This demonstration pediatric treatment building module is “kid-friendly,” offering a unique and cheerful environment where a child can feel most comfortable.


