

 Fire Station #4. Photo: courtesy HDR")
Top Local Government Sector Architecture Firms
| Rank | Company | 2013 Local Government Revenue |
| 1 | HOK | $55,452,267 |
| 2 | Stantec | $49,405,105 |
| 3 | Heery International | $44,704,482 |
| 4 | SHW Group | $40,016,000 |
| 5 | FreemanWhite | $25,833,487 |
| 6 | Moseley Architects | $20,046,498 |
| 7 | Skidmore, Owings & Merrill | $19,897,809 |
| 8 | PGAL | $15,361,017 |
| 9 | SmithGroupJJR | $14,348,220 |
| 10 | Quattrocchi Kwok Architects | $13,230,000 |
| 11 | Gensler | $13,040,471 |
| 12 | RS&H | $12,250,000 |
| 13 | BLDD Architects | $11,800,000 |
| 14 | Perkins+will | $9,226,704 |
| 15 | Clark Nexsen | $8,809,308 |
| 16 | HNTB Corp. | $8,423,750 |
| 17 | HKS | $6,837,590 |
| 18 | SchenkelShultz Architecture | $6,469,000 |
| 19 | Fentress Architects | $6,419,230 |
| 20 | LMN Architects | $6,195,600 |
| 21 | HDR | $6,188,900 |
| 22 | NBBJ | $6,034,000 |
| 23 | HMC Architects | $5,693,289 |
| 24 | LaBella Associates | $5,095,000 |
| 25 | ZGF Architects | $4,706,985 |
| 26 | Harley Ellis Devereaux | $4,310,000 |
| 27 | Hammel, Green and Abrahamson | $4,156,642 |
| 28 | FGM Architects | $3,625,486 |
| 29 | Leo A Daly | $3,577,658 |
| 30 | Wight & Company | $3,219,000 |
| 31 | Morris Architects | $2,700,000 |
| 32 | Page | $2,522,000 |
| 33 | Beyer Blinder Belle | $2,433,253 |
| 34 | DLR Group | $2,300,000 |
| 35 | Ennead Architects | $2,282,000 |
| 36 | LPA | $2,205,538 |
| 37 | Becker Morgan Group | $2,200,978 |
| 38 | KZF Design | $2,069,963 |
| 39 | Solomon Cordwell Buenz | $2,000,000 |
| 40 | Little | $1,961,000 |
| 41 | Goodwyn Mills & Cawood | $1,820,095 |
| 42 | Ratio Architects | $1,553,904 |
| 43 | CTA Architects Engineers | $1,353,350 |
| 44 | RNL | $1,306,000 |
| 45 | Rosser International | $1,207,719 |
| 46 | Bergmann Associates | $1,100,000 |
| 47 | Gresham, Smith and Partners | $1,034,930 |
| 48 | Smallwood, Reynolds, Stewart, Stewart & Associates | $1,009,754 |
| 49 | Harvard Jolly Architecture | $964,607 |
| 50 | OZ Architecture | $955,887 |
| 51 | Parkhill, Smith & Cooper | $903,000 |
| 52 | Legat Architects | $899,000 |
| 53 | Shepley Bulfinch | $836,000 |
| 54 | Integrus Architecture | $724,894 |
| 55 | Carrier Johnson + Culture | $700,000 |
| 56 | LS3P | $698,646 |
| 57 | GBBN Architects | $660,000 |
| 58 | Nadel | $650,000 |
| 59 | Eppstein Uhen Architects | $640,751 |
| 60 | Perkins Eastman | $625,000 |
| 61 | Cooper Carry | $623,543 |
| 62 | Swanke Hayden Connell Architects | $588,000 |
| 63 | RTKL Associates | $553,000 |
| 64 | Hastings+Chivetta Architects | $491,188 |
| 65 | Schrader Group Architecture | $448,540 |
| 66 | DesignGroup | $433,190 |
| 67 | Westlake Reed Leskosky | $375,000 |
| 68 | Environetics | $341,475 |
| 69 | VOA Associates | $329,883 |
| 70 | RSP Architects | $322,000 |
| 71 | H3 Hardy Collaboration Architecture | $305,903 |
| 72 | Hnedak Bobo Group | $301,000 |
| 73 | CO Architects | $296,300 |
| 74 | Hoefer Wysocki Architecture | $290,000 |
| 75 | Epstein | $276,000 |
| 76 | NAC|Architecture | $275,930 |
| 77 | Kirksey | $248,926 |
| 78 | NORR | $245,158 |
| 79 | Cuningham Group Architecture | $242,019 |
| 80 | TEG Architects | $231,640 |
| 81 | BRPH | $214,000 |
| 82 | Symmes Maini & McKee Associates | $210,000 |
| 83 | GWWO | $205,236 |
| 84 | Hoffmann Architects | $201,000 |
| 85 | BBS Architects | $200,030 |
| 86 | LawKingdon Architecture | $150,000 |
| 87 | DLA Architects | $133,140 |
| 88 | Good Fulton & Farrell | $132,000 |
| 89 | Baskervill | $130,226 |
| 90 | Flad Architects | $71,820 |
| 91 | Payette | $64,976 |
| 92 | Fanning/Howey Associates | $50,000 |
| 93 | ai Design Group | $33,048 |
| 94 | Commonwealth Architects | $28,586 |
| 95 | Emersion Design | $7,080 |
Top Local Government Sector Engineering Firms
| Rank | Company | 2013 Local Government Revenue |
| 1 | STV | $147,283,000 |
| 2 | Jacobs | $62,297,102 |
| 3 | AECOM Technology Corp. | $54,920,000 |
| 4 | URS Corp. | $23,752,766 |
| 5 | Smith Seckman Reid | $16,715,381 |
| 6 | Arup | $14,169,644 |
| 7 | Parsons Brinckerhoff | $13,307,900 |
| 8 | Syska Hennessy Group | $9,901,246 |
| 9 | Dewberry | $9,071,039 |
| 10 | Simpson Gumpertz & Heger | $7,056,000 |
| 11 | Walker Parking Consultants | $6,800,000 |
| 12 | Shive-Hattery | $5,892,722 |
| 13 | Leidos | $5,512,500 |
| 14 | Joseph R. Loring & Associates | $4,500,000 |
| 15 | Graef | $4,037,835 |
| 16 | KPFF Consulting Engineers | $3,500,000 |
| 17 | TLC Engineering for Architecture | $3,320,414 |
| 18 | WSP Group | $3,000,000 |
| 19 | Coffman Engineers | $2,960,639 |
| 20 | Glumac | $2,196,125 |
| 21 | M/E Engineering | $2,064,517 |
| 22 | Affiliated Engineers | $1,944,000 |
| 23 | Wiss, Janney, Elstner Associates | $1,800,000 |
| 24 | Sparling | $1,770,311 |
| 25 | Ross & Baruzzini | $1,487,622 |
| 26 | TTG | $1,350,000 |
| 27 | Thornton Tomasetti | $1,347,697 |
| 28 | Bridgers & Paxton Consulting Engineers | $1,343,223 |
| 29 | Interface Engineering | $1,263,610 |
| 30 | KJWW Engineering Consultants | $1,214,621 |
| 31 | RDK Engineers | $1,210,000 |
| 32 | Henderson Engineers | $1,194,249 |
| 33 | I. C. Thomasson Associates | $1,100,000 |
| 34 | French & Parrello Associates | $1,036,100 |
| 35 | CTLGroup | $810,000 |
| 36 | GRW | $789,852 |
| 37 | ThermalTech Engineering | $750,000 |
| 38 | Brinjac Engineering | $744,589 |
| 39 | Paulus, Sokolowski and Sartor | $710,000 |
| 40 | Primera Engineers | $662,000 |
| 41 | AKF Group | $533,000 |
| 42 | Barge Waggoner Sumner & Cannon | $515,000 |
| 43 | KCI Technologies | $500,000 |
| 44 | M-E Engineers | $500,000 |
| 45 | H&A Architects & Engineers | $475,000 |
| 46 | Environmental Systems Design | $422,421 |
| 47 | Spectrum Engineers | $415,043 |
| 48 | Vanderweil Engineers | $412,200 |
| 49 | Walter P Moore and Associates | $396,322 |
| 50 | Heapy Engineering | $358,894 |
| 51 | Davis, Bowen & Friedel | $353,571 |
| 52 | KLH Engineers | $320,634 |
| 53 | OLA Consulting Engineers | $262,000 |
| 54 | RMF Engineering | $250,000 |
| 55 | Highland Associates | $250,000 |
| 56 | CJL Engineering | $217,500 |
| 57 | Zak Companies | $208,120 |
| 58 | SSOE Group | $194,443 |
| 59 | Aon Fire Protection Engineering Corp. | $188,253 |
| 60 | Guernsey | $155,150 |
| 61 | Wallace Engineering | $120,000 |
| 62 | Apogee Consulting Group | $118,000 |
| 63 | H.F. Lenz | $100,000 |
| 64 | Rist-Frost-Shumway Engineering | $100,000 |
| 65 | GHT Limited | $100,000 |
| 66 | DeSimone Consulting Engineers | $90,000 |
| 67 | G&W Engineering Corp. | $78,500 |
| 68 | Stanley Consultants | $74,747 |
| 69 | Dunham Associates | $50,000 |
| 70 | Wick Fisher White | $48,530 |
| 71 | Total Building Commissioning | $31,349 |
| 72 | Allen & Shariff | $25,000 |
| 73 | Mazzetti | $12,860 |
Top Local Government Sector Construction Firms
| Rank | Company | 2013 Local Government Revenue |
| 1 | Turner Construction | $1,128,360,449 |
| 2 | Clark Group | $599,476,125 |
| 3 | Walsh Group, The | $489,238,513 |
| 4 | Hensel Phelps | $418,780,000 |
| 5 | Skanska USA | $380,024,542 |
| 6 | PCL Construction | $349,292,097 |
| 7 | Tutor Perini Corp. | $313,279,384 |
| 8 | Balfour Beatty US | $267,605,024 |
| 9 | McCarthy Holdings | $265,000,000 |
| 10 | Brasfield & Gorrie | $197,614,801 |
| 11 | Hunt Construction Group | $188,900,000 |
| 12 | Gilbane | $159,347,000 |
| 13 | STV | $147,283,000 |
| 14 | O'Neil Industries/W.E. O'Neil | $139,280,173 |
| 15 | JE Dunn Construction | $115,362,303 |
| 16 | CORE Construction Group | $81,514,627 |
| 17 | Messer Construction | $65,780,307 |
| 18 | Manhattan Construction | $59,675,022 |
| 19 | Hoffman Construction | $54,190,000 |
| 20 | Shawmut Design and Construction | $49,000,000 |
| 21 | Whiting-Turner Contracting Co., The | $45,840,363 |
| 22 | Heery International | $44,704,482 |
| 23 | HITT Contracting | $43,770,000 |
| 24 | C.W. Driver | $41,380,000 |
| 25 | Flintco | $39,319,870 |
| 26 | Hunt Companies | $32,546,568 |
| 27 | Wight & Company | $32,398,000 |
| 28 | Coakley & Williams Construction | $30,429,072 |
| 29 | Lend Lease | $28,150,000 |
| 30 | Yates Companies, The | $25,400,000 |
| 31 | Walbridge | $23,000,000 |
| 32 | Haselden Construction | $18,578,166 |
| 33 | Consigli Construction | $15,617,383 |
| 34 | Adolfson & Peterson Construction | $15,426,870 |
| 35 | Bernards | $14,000,000 |
| 36 | Parsons Brinckerhoff | $13,307,900 |
| 37 | LeChase Construction Services | $13,120,000 |
| 38 | Layton Construction | $12,800,000 |
| 39 | Kitchell Corp. | $11,821,501 |
| 40 | Hill & Wilkinson | $10,864,000 |
| 41 | New South Construction | $10,361,000 |
| 42 | Bomel Construction | $9,309,000 |
| 43 | Hill International | $9,000,000 |
| 44 | James McHugh Construction | $8,334,048 |
| 45 | W. M. Jordan Company | $7,422,045 |
| 46 | Holder Construction | $7,385,000 |
| 47 | Choate Construction | $6,904,117 |
| 48 | Leopardo Companies | $6,777,423 |
| 49 | Absher Construction | $6,107,896 |
| 50 | Stalco Construction | $5,620,500 |
| 51 | Weitz Company, The | $4,000,000 |
| 52 | Ryan Companies US | $3,057,682 |
| 53 | Kraus-Anderson Construction | $3,000,000 |
| 54 | Structure Tone | $2,998,100 |
| 55 | Sundt Construction | $2,754,904 |
| 56 | Bette Companies, The | $2,697,000 |
| 57 | Batson-Cook | $1,390,120 |
| 58 | Hoar Construction | $1,198,000 |
| 59 | S. M. Wilson & Co. | $1,060,764 |
| 60 | Paric Corp. | $1,000,000 |
| 61 | E.W. Howell | $343,000 |
| 62 | Fortis Construction | $300,000 |
| 63 | BlueScope Construction | $194,507 |
| 64 | KBE Building Corp. | $129,011 |
| 65 | LPCiminelli | $104,118 |
| 66 | IMC Construction | $75,000 |
| 67 | Astorino | $59,002 |
| 68 | Allen & Shariff | $25,000 |
Read BD+C's full 2014 Giants 300 Report
Related Stories
| Jan 16, 2014
ASHRAE revised climatic data for building design standards
ASHRAE Standard 169, Climatic Data for Building Design Standards, now includes climatic data for 5,564 locations throughout the world.

| Jan 15, 2014
6 social media skills every leader needs
The social media revolution—which is less than a decade old—has created a dilemma for senior executives. While its potential seems immense, the inherent risks create uncertainty and unease.

| Jan 15, 2014
Report: 32 U.S. buildings have been verified as net-zero energy performers
The New Buildings Institute's 2014 Getting to Zero Status report includes an interactive map detailing the net-zero energy buildings that have been verified by NBI.
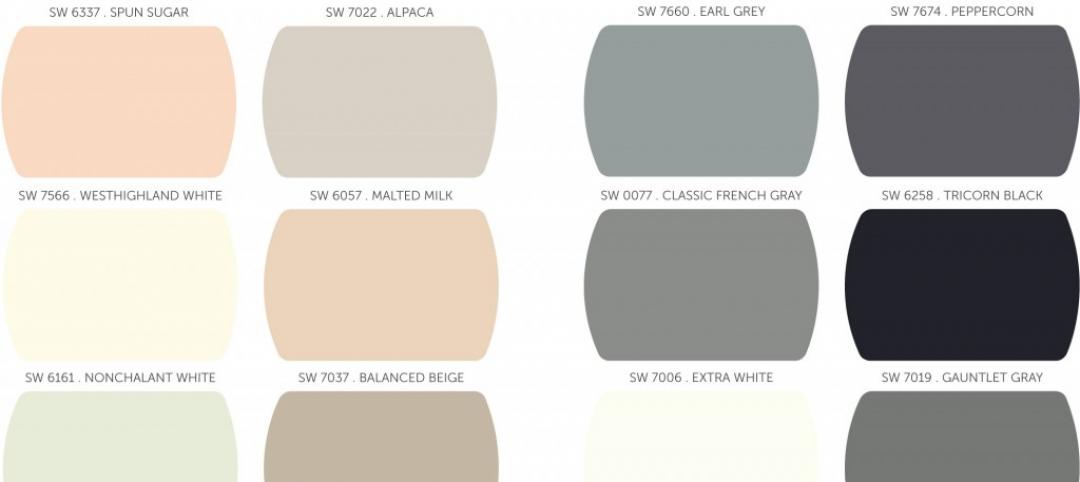
| Jan 14, 2014
Sherwin-Williams unveils colormix 2014
Drawing influence from fashion, science, nature, pop culture and global traditions, Sherwin-Williams introduces colormix™ 2014, which captures colors that inspire creativity and design in today’s world. The four-palette collection provides design professionals with a guide to help them define the moods they want to create and select colors for their projects.

| Jan 13, 2014
Custom exterior fabricator A. Zahner unveils free façade design software for architects
The web-based tool uses the company's factory floor like "a massive rapid prototype machine,” allowing designers to manipulate designs on the fly based on cost and other factors, according to CEO/President Bill Zahner.

| Jan 13, 2014
AEC professionals weigh in on school security
An exclusive survey reveals that Building Teams are doing their part to make the nation’s schools safer in the aftermath of the Sandy Hook tragedy.

| Jan 13, 2014
6 legislative actions to ignite the construction economy
The American Institute of Architects announced its “punch list” for Congress that, if completed, will ignite the construction economy by spurring much needed improvements in energy efficiency, infrastructure, and resiliency, and create jobs for small business.

| Jan 12, 2014
CES showcases innovations: Can any of these help you do your job better?
The Consumer Electronics Show took place this past week in Las Vegas. Known for launching new products and technologies, many of the products showcased there set the bar for future innovators. The show also signals trends to watch in technology applicable to the design and building industry.

| Jan 12, 2014
The ‘fuzz factor’ in engineering: when continuous improvement is neither
The biggest threat to human life in a building isn’t the potential of natural disasters, but the threat of human error. I believe it’s a reality that increases in probability every time a code or standard change is proposed.
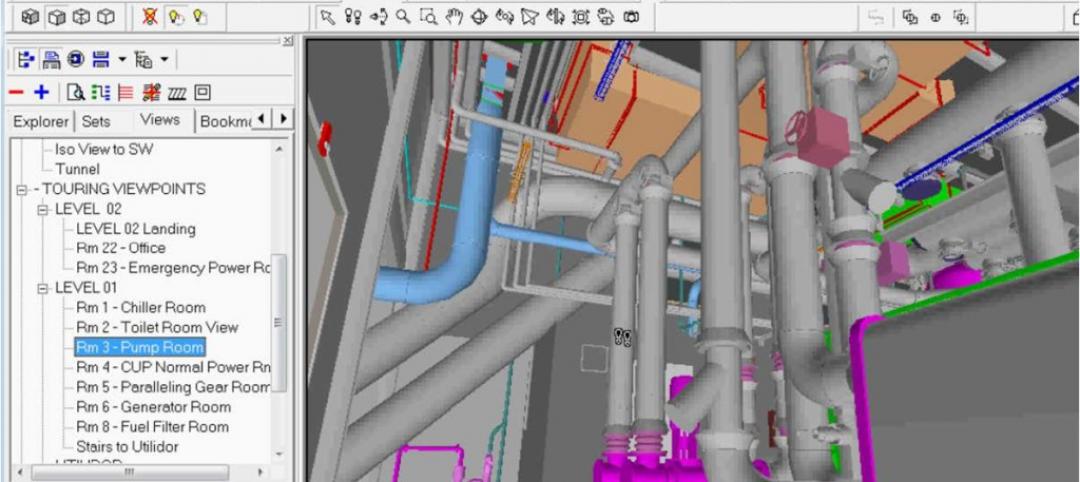
| Jan 12, 2014
5 ways virtual modeling can improve facilities management
Improved space management, streamlined maintenance, and economical retrofits are among the ways building owners and facility managers can benefit from building information modeling.


