

 Fire Station #4. Photo: courtesy HDR")
Top Local Government Sector Architecture Firms
| Rank | Company | 2013 Local Government Revenue |
| 1 | HOK | $55,452,267 |
| 2 | Stantec | $49,405,105 |
| 3 | Heery International | $44,704,482 |
| 4 | SHW Group | $40,016,000 |
| 5 | FreemanWhite | $25,833,487 |
| 6 | Moseley Architects | $20,046,498 |
| 7 | Skidmore, Owings & Merrill | $19,897,809 |
| 8 | PGAL | $15,361,017 |
| 9 | SmithGroupJJR | $14,348,220 |
| 10 | Quattrocchi Kwok Architects | $13,230,000 |
| 11 | Gensler | $13,040,471 |
| 12 | RS&H | $12,250,000 |
| 13 | BLDD Architects | $11,800,000 |
| 14 | Perkins+will | $9,226,704 |
| 15 | Clark Nexsen | $8,809,308 |
| 16 | HNTB Corp. | $8,423,750 |
| 17 | HKS | $6,837,590 |
| 18 | SchenkelShultz Architecture | $6,469,000 |
| 19 | Fentress Architects | $6,419,230 |
| 20 | LMN Architects | $6,195,600 |
| 21 | HDR | $6,188,900 |
| 22 | NBBJ | $6,034,000 |
| 23 | HMC Architects | $5,693,289 |
| 24 | LaBella Associates | $5,095,000 |
| 25 | ZGF Architects | $4,706,985 |
| 26 | Harley Ellis Devereaux | $4,310,000 |
| 27 | Hammel, Green and Abrahamson | $4,156,642 |
| 28 | FGM Architects | $3,625,486 |
| 29 | Leo A Daly | $3,577,658 |
| 30 | Wight & Company | $3,219,000 |
| 31 | Morris Architects | $2,700,000 |
| 32 | Page | $2,522,000 |
| 33 | Beyer Blinder Belle | $2,433,253 |
| 34 | DLR Group | $2,300,000 |
| 35 | Ennead Architects | $2,282,000 |
| 36 | LPA | $2,205,538 |
| 37 | Becker Morgan Group | $2,200,978 |
| 38 | KZF Design | $2,069,963 |
| 39 | Solomon Cordwell Buenz | $2,000,000 |
| 40 | Little | $1,961,000 |
| 41 | Goodwyn Mills & Cawood | $1,820,095 |
| 42 | Ratio Architects | $1,553,904 |
| 43 | CTA Architects Engineers | $1,353,350 |
| 44 | RNL | $1,306,000 |
| 45 | Rosser International | $1,207,719 |
| 46 | Bergmann Associates | $1,100,000 |
| 47 | Gresham, Smith and Partners | $1,034,930 |
| 48 | Smallwood, Reynolds, Stewart, Stewart & Associates | $1,009,754 |
| 49 | Harvard Jolly Architecture | $964,607 |
| 50 | OZ Architecture | $955,887 |
| 51 | Parkhill, Smith & Cooper | $903,000 |
| 52 | Legat Architects | $899,000 |
| 53 | Shepley Bulfinch | $836,000 |
| 54 | Integrus Architecture | $724,894 |
| 55 | Carrier Johnson + Culture | $700,000 |
| 56 | LS3P | $698,646 |
| 57 | GBBN Architects | $660,000 |
| 58 | Nadel | $650,000 |
| 59 | Eppstein Uhen Architects | $640,751 |
| 60 | Perkins Eastman | $625,000 |
| 61 | Cooper Carry | $623,543 |
| 62 | Swanke Hayden Connell Architects | $588,000 |
| 63 | RTKL Associates | $553,000 |
| 64 | Hastings+Chivetta Architects | $491,188 |
| 65 | Schrader Group Architecture | $448,540 |
| 66 | DesignGroup | $433,190 |
| 67 | Westlake Reed Leskosky | $375,000 |
| 68 | Environetics | $341,475 |
| 69 | VOA Associates | $329,883 |
| 70 | RSP Architects | $322,000 |
| 71 | H3 Hardy Collaboration Architecture | $305,903 |
| 72 | Hnedak Bobo Group | $301,000 |
| 73 | CO Architects | $296,300 |
| 74 | Hoefer Wysocki Architecture | $290,000 |
| 75 | Epstein | $276,000 |
| 76 | NAC|Architecture | $275,930 |
| 77 | Kirksey | $248,926 |
| 78 | NORR | $245,158 |
| 79 | Cuningham Group Architecture | $242,019 |
| 80 | TEG Architects | $231,640 |
| 81 | BRPH | $214,000 |
| 82 | Symmes Maini & McKee Associates | $210,000 |
| 83 | GWWO | $205,236 |
| 84 | Hoffmann Architects | $201,000 |
| 85 | BBS Architects | $200,030 |
| 86 | LawKingdon Architecture | $150,000 |
| 87 | DLA Architects | $133,140 |
| 88 | Good Fulton & Farrell | $132,000 |
| 89 | Baskervill | $130,226 |
| 90 | Flad Architects | $71,820 |
| 91 | Payette | $64,976 |
| 92 | Fanning/Howey Associates | $50,000 |
| 93 | ai Design Group | $33,048 |
| 94 | Commonwealth Architects | $28,586 |
| 95 | Emersion Design | $7,080 |
Top Local Government Sector Engineering Firms
| Rank | Company | 2013 Local Government Revenue |
| 1 | STV | $147,283,000 |
| 2 | Jacobs | $62,297,102 |
| 3 | AECOM Technology Corp. | $54,920,000 |
| 4 | URS Corp. | $23,752,766 |
| 5 | Smith Seckman Reid | $16,715,381 |
| 6 | Arup | $14,169,644 |
| 7 | Parsons Brinckerhoff | $13,307,900 |
| 8 | Syska Hennessy Group | $9,901,246 |
| 9 | Dewberry | $9,071,039 |
| 10 | Simpson Gumpertz & Heger | $7,056,000 |
| 11 | Walker Parking Consultants | $6,800,000 |
| 12 | Shive-Hattery | $5,892,722 |
| 13 | Leidos | $5,512,500 |
| 14 | Joseph R. Loring & Associates | $4,500,000 |
| 15 | Graef | $4,037,835 |
| 16 | KPFF Consulting Engineers | $3,500,000 |
| 17 | TLC Engineering for Architecture | $3,320,414 |
| 18 | WSP Group | $3,000,000 |
| 19 | Coffman Engineers | $2,960,639 |
| 20 | Glumac | $2,196,125 |
| 21 | M/E Engineering | $2,064,517 |
| 22 | Affiliated Engineers | $1,944,000 |
| 23 | Wiss, Janney, Elstner Associates | $1,800,000 |
| 24 | Sparling | $1,770,311 |
| 25 | Ross & Baruzzini | $1,487,622 |
| 26 | TTG | $1,350,000 |
| 27 | Thornton Tomasetti | $1,347,697 |
| 28 | Bridgers & Paxton Consulting Engineers | $1,343,223 |
| 29 | Interface Engineering | $1,263,610 |
| 30 | KJWW Engineering Consultants | $1,214,621 |
| 31 | RDK Engineers | $1,210,000 |
| 32 | Henderson Engineers | $1,194,249 |
| 33 | I. C. Thomasson Associates | $1,100,000 |
| 34 | French & Parrello Associates | $1,036,100 |
| 35 | CTLGroup | $810,000 |
| 36 | GRW | $789,852 |
| 37 | ThermalTech Engineering | $750,000 |
| 38 | Brinjac Engineering | $744,589 |
| 39 | Paulus, Sokolowski and Sartor | $710,000 |
| 40 | Primera Engineers | $662,000 |
| 41 | AKF Group | $533,000 |
| 42 | Barge Waggoner Sumner & Cannon | $515,000 |
| 43 | KCI Technologies | $500,000 |
| 44 | M-E Engineers | $500,000 |
| 45 | H&A Architects & Engineers | $475,000 |
| 46 | Environmental Systems Design | $422,421 |
| 47 | Spectrum Engineers | $415,043 |
| 48 | Vanderweil Engineers | $412,200 |
| 49 | Walter P Moore and Associates | $396,322 |
| 50 | Heapy Engineering | $358,894 |
| 51 | Davis, Bowen & Friedel | $353,571 |
| 52 | KLH Engineers | $320,634 |
| 53 | OLA Consulting Engineers | $262,000 |
| 54 | RMF Engineering | $250,000 |
| 55 | Highland Associates | $250,000 |
| 56 | CJL Engineering | $217,500 |
| 57 | Zak Companies | $208,120 |
| 58 | SSOE Group | $194,443 |
| 59 | Aon Fire Protection Engineering Corp. | $188,253 |
| 60 | Guernsey | $155,150 |
| 61 | Wallace Engineering | $120,000 |
| 62 | Apogee Consulting Group | $118,000 |
| 63 | H.F. Lenz | $100,000 |
| 64 | Rist-Frost-Shumway Engineering | $100,000 |
| 65 | GHT Limited | $100,000 |
| 66 | DeSimone Consulting Engineers | $90,000 |
| 67 | G&W Engineering Corp. | $78,500 |
| 68 | Stanley Consultants | $74,747 |
| 69 | Dunham Associates | $50,000 |
| 70 | Wick Fisher White | $48,530 |
| 71 | Total Building Commissioning | $31,349 |
| 72 | Allen & Shariff | $25,000 |
| 73 | Mazzetti | $12,860 |
Top Local Government Sector Construction Firms
| Rank | Company | 2013 Local Government Revenue |
| 1 | Turner Construction | $1,128,360,449 |
| 2 | Clark Group | $599,476,125 |
| 3 | Walsh Group, The | $489,238,513 |
| 4 | Hensel Phelps | $418,780,000 |
| 5 | Skanska USA | $380,024,542 |
| 6 | PCL Construction | $349,292,097 |
| 7 | Tutor Perini Corp. | $313,279,384 |
| 8 | Balfour Beatty US | $267,605,024 |
| 9 | McCarthy Holdings | $265,000,000 |
| 10 | Brasfield & Gorrie | $197,614,801 |
| 11 | Hunt Construction Group | $188,900,000 |
| 12 | Gilbane | $159,347,000 |
| 13 | STV | $147,283,000 |
| 14 | O'Neil Industries/W.E. O'Neil | $139,280,173 |
| 15 | JE Dunn Construction | $115,362,303 |
| 16 | CORE Construction Group | $81,514,627 |
| 17 | Messer Construction | $65,780,307 |
| 18 | Manhattan Construction | $59,675,022 |
| 19 | Hoffman Construction | $54,190,000 |
| 20 | Shawmut Design and Construction | $49,000,000 |
| 21 | Whiting-Turner Contracting Co., The | $45,840,363 |
| 22 | Heery International | $44,704,482 |
| 23 | HITT Contracting | $43,770,000 |
| 24 | C.W. Driver | $41,380,000 |
| 25 | Flintco | $39,319,870 |
| 26 | Hunt Companies | $32,546,568 |
| 27 | Wight & Company | $32,398,000 |
| 28 | Coakley & Williams Construction | $30,429,072 |
| 29 | Lend Lease | $28,150,000 |
| 30 | Yates Companies, The | $25,400,000 |
| 31 | Walbridge | $23,000,000 |
| 32 | Haselden Construction | $18,578,166 |
| 33 | Consigli Construction | $15,617,383 |
| 34 | Adolfson & Peterson Construction | $15,426,870 |
| 35 | Bernards | $14,000,000 |
| 36 | Parsons Brinckerhoff | $13,307,900 |
| 37 | LeChase Construction Services | $13,120,000 |
| 38 | Layton Construction | $12,800,000 |
| 39 | Kitchell Corp. | $11,821,501 |
| 40 | Hill & Wilkinson | $10,864,000 |
| 41 | New South Construction | $10,361,000 |
| 42 | Bomel Construction | $9,309,000 |
| 43 | Hill International | $9,000,000 |
| 44 | James McHugh Construction | $8,334,048 |
| 45 | W. M. Jordan Company | $7,422,045 |
| 46 | Holder Construction | $7,385,000 |
| 47 | Choate Construction | $6,904,117 |
| 48 | Leopardo Companies | $6,777,423 |
| 49 | Absher Construction | $6,107,896 |
| 50 | Stalco Construction | $5,620,500 |
| 51 | Weitz Company, The | $4,000,000 |
| 52 | Ryan Companies US | $3,057,682 |
| 53 | Kraus-Anderson Construction | $3,000,000 |
| 54 | Structure Tone | $2,998,100 |
| 55 | Sundt Construction | $2,754,904 |
| 56 | Bette Companies, The | $2,697,000 |
| 57 | Batson-Cook | $1,390,120 |
| 58 | Hoar Construction | $1,198,000 |
| 59 | S. M. Wilson & Co. | $1,060,764 |
| 60 | Paric Corp. | $1,000,000 |
| 61 | E.W. Howell | $343,000 |
| 62 | Fortis Construction | $300,000 |
| 63 | BlueScope Construction | $194,507 |
| 64 | KBE Building Corp. | $129,011 |
| 65 | LPCiminelli | $104,118 |
| 66 | IMC Construction | $75,000 |
| 67 | Astorino | $59,002 |
| 68 | Allen & Shariff | $25,000 |
Read BD+C's full 2014 Giants 300 Report
Related Stories

| Nov 21, 2014
Nelson adds to its stable with EHS Design acquisition
This represents Nelson’s fifth merger or acquisition in 2014, during which the firm’s net fee revenue has increased by 60% to $65 million.

| Nov 21, 2014
Nonresidential Construction Index rises in fourth quarter
There are a number of reasons for optimism among respondents of FMI's quarterly Nonresidential Construction Index survey, including healthier backlogs and low inflation.

| Nov 21, 2014
NCARB: Number of architects in U.S. grows 1.6% in 2014, surpasses 107,500
The architecture profession continues to grow along with a gradually recovering economy, based on the results of the 2014 Survey of Architectural Registration Boards, conducted by the National Council of Architectural Registration Boards.

| Nov 20, 2014
Lean Led Design: How Building Teams can cut costs, reduce waste in healthcare construction projects
Healthcare organizations are under extreme pressure to reduce costs, writes CBRE Healthcare's Lora Schwartz. Tools like Lean Led Design are helping them cope.
| Nov 19, 2014
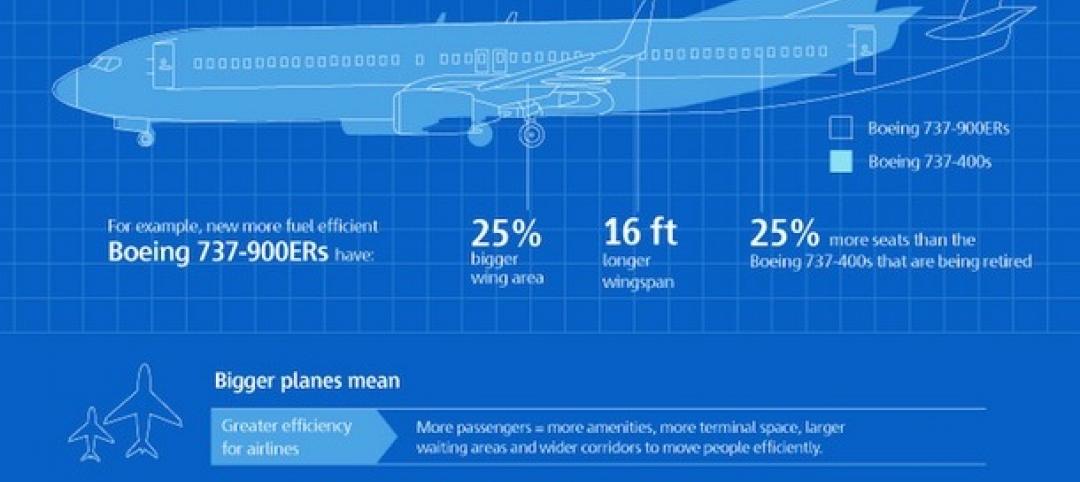
The evolution of airport design and construction [infographic]
Safety, consumer demand, and the new economics of flight are three of the major factors shaping how airlines and airport officials are approaching the need for upgrades and renovations, writes Skanska USA's MacAdam Glinn.

| Nov 19, 2014
Construction unemployment hits eight-year low, some states struggle to find qualified labor
The construction industry, whose workforce was decimated during the last recession, is slowly getting back on its feet. However, in certain markets—especially those where oil drilling and production have been prospering—construction workers can still be scarce.

Sponsored | | Nov 19, 2014
3 technology trends on the horizon
As technology continues to evolve exponentially, construction firms have ongoing opportunities to enhance the quality, speed, and efficiency of building projects and processes. SPONSORED CONTENT

Sponsored | | Nov 19, 2014
Long-life coatings vs. long-life screws
Are you concerned with the long-life protection of your metal building project? SPONSORED CONTENT

Sponsored | | Nov 19, 2014
Fire resistive, blast-resistant glazing: Where security, safety, and transparency converge
Security, safety and transparency don’t have to be mutually exclusive thanks to new glazing technology designed to support blast and fire-resistant secure buildings. SPONSORED CONTENT

| Nov 19, 2014
Must see: Arup, Damian Rogers propose urban surf park in Melbourne
The surfing pool would offer 98-foot-wide waves that would run the length of the 500-foot-long enclave.


