

Top Industrial Sector Architecture Firms
| Rank | Company | 2013 Industrial Facility Revenue |
| 1 | Stantec | $31,231,586 |
| 2 | Epstein | $19,220,000 |
| 3 | Ware Malcomb | $10,500,000 |
| 4 | Albert Kahn Associates | $9,833,000 |
| 5 | Gresham, Smith and Partners | $8,336,000 |
| 6 | Heery International | $5,373,672 |
| 7 | Clark Nexsen | $5,053,305 |
| 8 | Leo A Daly | $4,391,472 |
| 9 | Bergmann Associates | $2,997,560 |
| 10 | RSP Architects | $2,659,000 |
| 11 | RS&H | $2,450,000 |
| 12 | OZ Architecture | $2,113,400 |
| 13 | Lord Aeck Sargent | $2,089,009 |
| 14 | Goodwyn Mills & Cawood | $1,722,486 |
| 15 | Gensler | $1,428,680 |
| 16 | Beyer Blinder Belle | $1,236,205 |
| 17 | Morris Architects | $1,120,000 |
| 18 | HOK | $994,827 |
| 19 | Kirksey | $942,400 |
| 20 | ATA Beilharz Architects | $879,540 |
| 21 | LaBella Associates | $684,001 |
| 22 | JRS Architect | $680,000 |
| 23 | Francis Cauffman | $504,371 |
| 24 | LS3P | $482,408 |
| 25 | Harley Ellis Devereaux | $480,000 |
| 26 | HNTB Corp. | $448,901 |
| 27 | Baskervill | $448,606 |
| 28 | Environetics | $447,858 |
| 29 | VOA Associates | $425,000 |
| 30 | KZF Design | $417,500 |
| 31 | NORR | $410,487 |
| 32 | Moody Nolan | $361,308 |
| 33 | Hammel, Green and Abrahamson | $356,579 |
| 34 | Symmes Maini & McKee Associates | $330,000 |
| 35 | Corgan | $301,658 |
| 36 | Inventure Design Group | $267,111 |
| 37 | MBH Architects | $250,000 |
| 38 | Nelson | $200,905 |
| 39 | Perkins+will | $200,000 |
| 40 | ZGF Architects | $166,599 |
| 41 | FGM Architects | $151,212 |
| 42 | Poskanzer Skott | $150,000 |
| 43 | Wight & Company | $148,000 |
| 44 | Eppstein Uhen Architects | $129,099 |
| 45 | TEG Architects | $116,895 |
| 46 | S/L/A/M Collaborative, The | $100,899 |
| 47 | ai Design Group | $96,174 |
| 48 | Margulies Perruzzi Architects | $54,933 |
| 49 | Parkhill, Smith & Cooper | $54,000 |
| 50 | Hoffmann Architects | $51,000 |
| 51 | CASCO Diversified Corp. | $50,000 |
| 52 | Becker Morgan Group | $37,128 |
| 53 | Emersion Design | $27,353 |
| 54 | BRPH | $21,359 |
| 55 | Nadel | $20,000 |
| 56 | SchenkelShultz Architecture | $9,000 |
| 57 | NAC|Architecture | $5,805 |
| 58 | Mithun | $5,000 |
Top Industrial Sector Engineering Firms
| Rank | Company | 2013 Industrial Facility Revenue |
| 1 | Jacobs | $2,454,640,000 |
| 2 | Fluor Corporation | $978,710,000 |
| 3 | Day & Zimmermann | $130,576,072 |
| 4 | Leidos | $128,150,000 |
| 5 | SSOE Group | $103,744,174 |
| 6 | CRB | $86,164,350 |
| 7 | Burns & McDonnell | $65,880,000 |
| 8 | URS Corp. | $25,229,129 |
| 9 | Barge Waggoner Sumner & Cannon | $22,600,000 |
| 10 | ThermalTech Engineering | $20,650,000 |
| 11 | Affiliated Engineers | $14,967,000 |
| 12 | Parsons Brinckerhoff | $13,887,018 |
| 13 | Hixson Architecture, Engineering, Interiors | $12,000,000 |
| 14 | Glumac | $11,608,629 |
| 15 | Coffman Engineers | $8,485,055 |
| 16 | Dewberry | $8,293,503 |
| 17 | Simpson Gumpertz & Heger | $6,990,000 |
| 18 | Shive-Hattery | $6,941,997 |
| 19 | STV | $6,087,000 |
| 20 | KJWW Engineering Consultants | $4,875,191 |
| 21 | I. C. Thomasson Associates | $4,700,000 |
| 22 | Wiss, Janney, Elstner Associates | $3,910,000 |
| 23 | Stanley Consultants | $3,879,745 |
| 24 | Graef | $3,784,315 |
| 25 | Zak Companies | $3,782,825 |
| 26 | Arup | $2,883,064 |
| 27 | Magnusson Klemencic Associates | $2,795,955 |
| 28 | Guernsey | $2,726,472 |
| 29 | Martin/Martin | $2,446,592 |
| 30 | RMF Engineering | $2,425,000 |
| 31 | H.F. Lenz | $2,170,130 |
| 32 | P2S Engineering | $2,155,234 |
| 33 | M/E Engineering | $2,067,101 |
| 34 | Highland Associates | $2,000,000 |
| 35 | Paulus, Sokolowski and Sartor | $1,500,000 |
| 36 | Smith Seckman Reid | $1,379,596 |
| 37 | Vanderweil Engineers | $1,359,000 |
| 38 | Walter P Moore and Associates | $1,316,496 |
| 39 | Wallace Engineering | $1,219,000 |
| 40 | Aon Fire Protection Engineering Corp. | $1,150,000 |
| 41 | Bridgers & Paxton Consulting Engineers | $950,537 |
| 42 | Wick Fisher White | $945,203 |
| 43 | AKF Group | $863,000 |
| 44 | Karpinski Engineering | $796,700 |
| 45 | Thornton Tomasetti | $731,262 |
| 46 | Spectrum Engineers | $637,074 |
| 47 | Henderson Engineers | $619,216 |
| 48 | RDK Engineers | $610,000 |
| 49 | CJL Engineering | $552,450 |
| 50 | WSP Group | $470,000 |
| 51 | Interface Engineering | $461,622 |
| 52 | CTLGroup | $450,000 |
| 53 | Fishbeck, Thompson, Carr & Huber | $400,000 |
| 54 | Dunham Associates | $335,000 |
| 55 | Kamm Consulting | $306,791 |
| 56 | GHT Limited | $300,000 |
| 57 | TLC Engineering for Architecture | $276,713 |
| 58 | French & Parrello Associates | $269,000 |
| 59 | OLA Consulting Engineers | $257,000 |
| 60 | Apogee Consulting Group | $215,365 |
| 61 | M-E Engineers | $200,000 |
| 62 | KCI Technologies | $200,000 |
| 63 | Environmental Systems Design | $164,829 |
| 64 | G&W Engineering Corp. | $108,900 |
| 65 | Total Building Commissioning | $90,558 |
| 66 | Allen & Shariff | $80,000 |
| 67 | Davis, Bowen & Friedel | $59,236 |
| 68 | Heapy Engineering | $33,420 |
| 69 | GRW | $32,000 |
| 70 | Newcomb & Boyd | $28,562 |
| 71 | Mazzetti | $25,844 |
| 72 | Brinjac Engineering | $4,137 |
Top Industrial Sector Construction Firms
| Rank | Company | 2013 Industrial Facility Revenue |
| 1 | Turner Construction | $1,471,110,000 |
| 2 | Hoffman Construction | $1,202,000,000 |
| 3 | Walbridge | $929,200,000 |
| 4 | Yates Companies, The | $733,300,000 |
| 5 | Skanska USA | $689,994,679 |
| 6 | Gray Construction | $603,600,000 |
| 7 | Haskell | $454,396,992 |
| 8 | Clayco | $437,700,000 |
| 9 | Barton Malow | $435,381,455 |
| 10 | Gilbane | $337,445,270 |
| 11 | Whiting-Turner Contracting Co., The | $309,171,329 |
| 12 | Boldt Company, The | $283,320,400 |
| 13 | Brasfield & Gorrie | $246,596,893 |
| 14 | McShane Companies, The | $207,632,355 |
| 15 | Alberici Constructors | $205,875,885 |
| 16 | Ryan Companies US | $168,024,936 |
| 17 | McCarthy Holdings | $156,000,000 |
| 18 | Weitz Company, The | $149,150,605 |
| 19 | Tutor Perini Corp. | $138,266,084 |
| 20 | Hill & Wilkinson | $112,161,000 |
| 21 | Layton Construction | $111,400,000 |
| 22 | Graycor | $111,011,639 |
| 23 | Choate Construction | $97,994,926 |
| 24 | Hunt Construction Group | $78,000,000 |
| 25 | Hensel Phelps | $74,840,000 |
| 26 | EMJ Corp. | $72,000,000 |
| 27 | Pepper Construction | $66,570,000 |
| 28 | B. L. Harbert International | $59,035,052 |
| 29 | Robins & Morton | $58,297,183 |
| 30 | BlueScope Construction | $57,882,134 |
| 31 | Hoar Construction | $44,246,000 |
| 32 | C.W. Driver | $42,000,000 |
| 33 | Leopardo Companies | $40,981,704 |
| 34 | Messer Construction | $36,250,600 |
| 35 | S. M. Wilson & Co. | $34,384,608 |
| 36 | LeChase Construction Services | $32,800,000 |
| 37 | Lend Lease | $31,576,000 |
| 38 | Power Construction | $31,000,000 |
| 39 | McGough | $30,000,000 |
| 40 | JE Dunn Construction | $27,003,412 |
| 41 | Hathaway Dinwiddie Construction | $27,000,000 |
| 42 | O'Neil Industries/W.E. O'Neil | $25,322,275 |
| 43 | IMC Construction | $25,053,600 |
| 44 | Walsh Group, The | $21,687,693 |
| 45 | DPR Construction | $21,478,896 |
| 46 | New South Construction | $21,171,000 |
| 47 | Adolfson & Peterson Construction | $20,989,300 |
| 48 | Balfour Beatty US | $20,923,086 |
| 49 | HITT Contracting | $20,400,000 |
| 50 | Hill International | $17,000,000 |
| 51 | Coakley & Williams Construction | $16,557,262 |
| 52 | Parsons Brinckerhoff | $13,887,018 |
| 53 | Batson-Cook | $13,716,852 |
| 54 | Austin Commercial | $13,378,823 |
| 55 | CORE Construction Group | $12,445,450 |
| 56 | LPCiminelli | $11,931,788 |
| 57 | PCL Construction | $11,470,039 |
| 58 | JLL | $7,062,800 |
| 59 | STV | $6,087,000 |
| 60 | Beck Group, The | $5,624,708 |
| 61 | EBCO General Contractor | $5,611,000 |
| 62 | Heery International | $5,373,672 |
| 63 | James McHugh Construction | $5,304,373 |
| 64 | Holder Construction | $4,321,000 |
| 65 | Bernards | $4,000,000 |
| 66 | KBE Building Corp. | $3,465,079 |
| 67 | W. M. Jordan Company | $2,859,431 |
| 68 | Manhattan Construction | $2,154,000 |
| 69 | Stalco Construction | $1,890,000 |
| 70 | Wight & Company | $903,000 |
| 71 | Allen & Shariff | $80,000 |
| 72 | Astorino | $21,243 |
| 73 | Kitchell Corp. | $15,329 |
Read BD+C's full 2014 Giants 300 Report
Related Stories
| Nov 2, 2010
Energy Analysis No Longer a Luxury
Back in the halcyon days of 2006, energy analysis of building design and performance was a luxury. Sure, many forward-thinking AEC firms ran their designs through services such as Autodesk’s Green Building Studio and IES’s Virtual Environment, and some facility managers used Honeywell’s Energy Manager and other monitoring software. Today, however, knowing exactly how much energy your building will produce and use is survival of the fittest as energy costs and green design requirements demand precision.

| Nov 2, 2010
Yudelson: ‘If It Doesn’t Perform, It Can’t Be Green’
Jerry Yudelson, prolific author and veteran green building expert, challenges Building Teams to think big when it comes to controlling energy use and reducing carbon emissions in buildings.
| Nov 2, 2010
Historic changes to commercial building energy codes drive energy efficiency, emissions reductions
Revisions to the commercial section of the 2012 International Energy Conservation Code (IECC) represent the largest single-step efficiency increase in the history of the national, model energy. The changes mean that new and renovated buildings constructed in jurisdictions that follow the 2012 IECC will use 30% less energy than those built to current standards.
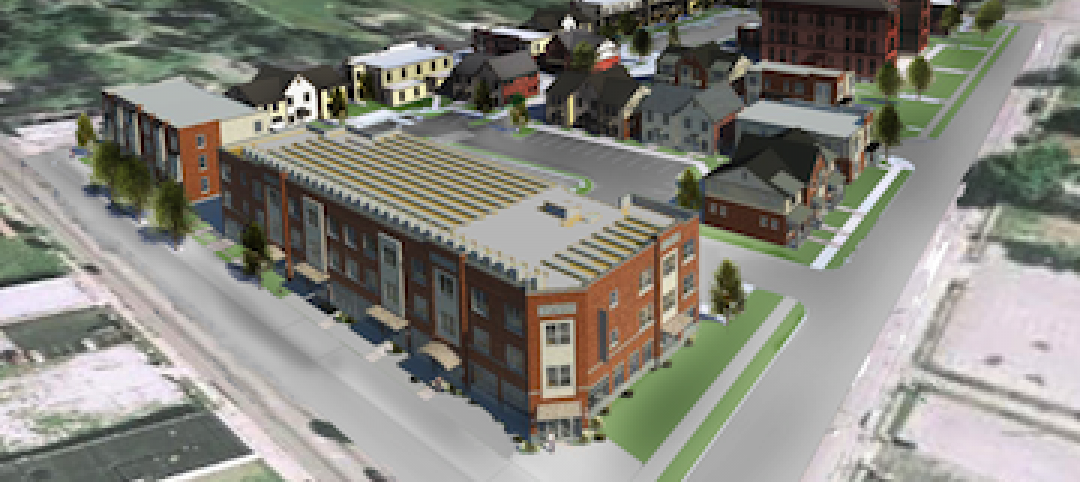
| Nov 1, 2010
Sustainable, mixed-income housing to revitalize community
The $41 million Arlington Grove mixed-use development in St. Louis is viewed as a major step in revitalizing the community. Developed by McCormack Baron Salazar with KAI Design & Build (architect, MEP, GC), the project will add 112 new and renovated mixed-income rental units (market rate, low-income, and public housing) totaling 162,000 sf, plus 5,000 sf of commercial/retail space.

| Nov 1, 2010
John Pearce: First thing I tell designers: Do your homework!
John Pearce, FAIA, University Architect at Duke University, Durham, N.C., tells BD+C’s Robert Cassidy about the school’s construction plans and sustainability efforts, how to land work at Duke, and why he’s proceeding with caution when it comes to BIM.
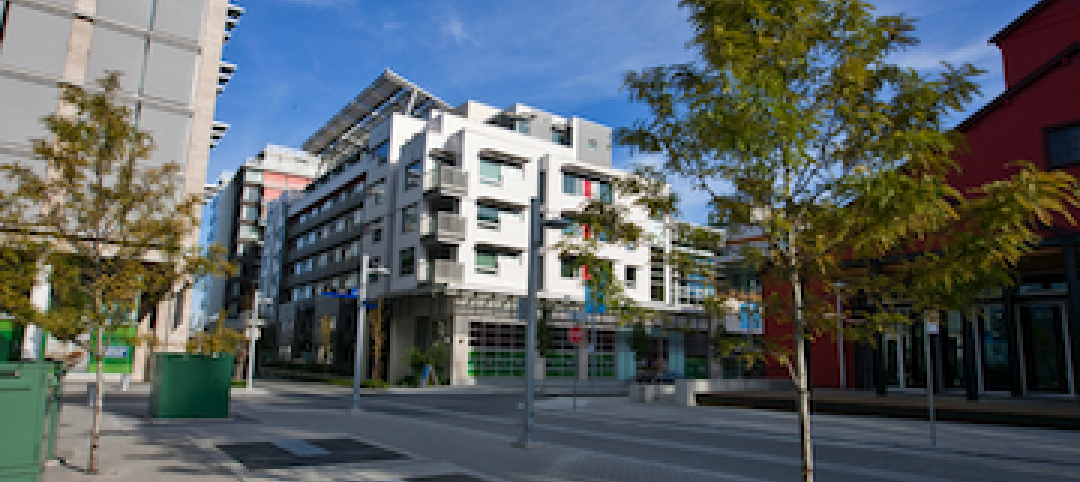
| Nov 1, 2010
Vancouver’s former Olympic Village shoots for Gold
The first tenants of the Millennium Water development in Vancouver, B.C., were Olympic athletes competing in the 2010 Winter Games. Now the former Olympic Village, located on a 17-acre brownfield site, is being transformed into a residential neighborhood targeting LEED ND Gold. The buildings are expected to consume 30-70% less energy than comparable structures.

| Oct 27, 2010
Grid-neutral education complex to serve students, community
MVE Institutional designed the Downtown Educational Complex in Oakland, Calif., to serve as an educational facility, community center, and grid-neutral green building. The 123,000-sf complex, now under construction on a 5.5-acre site in the city’s Lake Merritt neighborhood, will be built in two phases, the first expected to be completed in spring 2012 and the second in fall 2014.

| Oct 21, 2010
GSA confirms new LEED Gold requirement
The General Services Administration has increased its sustainability requirements and now mandates LEED Gold for its projects.
| Oct 18, 2010
World’s first zero-carbon city on track in Abu Dhabi
Masdar City, the world’s only zero-carbon city, is on track to be built in Abu Dhabi, with completion expected as early as 2020. Foster + Partners developed the $22 billion city’s master plan, with Adrian Smith + Gordon Gill Architecture, Aedas, and Lava Architects designing buildings for the project’s first phase, which is on track to be ready for occupancy by 2015.


