

Top Industrial Sector Architecture Firms
| Rank | Company | 2013 Industrial Facility Revenue |
| 1 | Stantec | $31,231,586 |
| 2 | Epstein | $19,220,000 |
| 3 | Ware Malcomb | $10,500,000 |
| 4 | Albert Kahn Associates | $9,833,000 |
| 5 | Gresham, Smith and Partners | $8,336,000 |
| 6 | Heery International | $5,373,672 |
| 7 | Clark Nexsen | $5,053,305 |
| 8 | Leo A Daly | $4,391,472 |
| 9 | Bergmann Associates | $2,997,560 |
| 10 | RSP Architects | $2,659,000 |
| 11 | RS&H | $2,450,000 |
| 12 | OZ Architecture | $2,113,400 |
| 13 | Lord Aeck Sargent | $2,089,009 |
| 14 | Goodwyn Mills & Cawood | $1,722,486 |
| 15 | Gensler | $1,428,680 |
| 16 | Beyer Blinder Belle | $1,236,205 |
| 17 | Morris Architects | $1,120,000 |
| 18 | HOK | $994,827 |
| 19 | Kirksey | $942,400 |
| 20 | ATA Beilharz Architects | $879,540 |
| 21 | LaBella Associates | $684,001 |
| 22 | JRS Architect | $680,000 |
| 23 | Francis Cauffman | $504,371 |
| 24 | LS3P | $482,408 |
| 25 | Harley Ellis Devereaux | $480,000 |
| 26 | HNTB Corp. | $448,901 |
| 27 | Baskervill | $448,606 |
| 28 | Environetics | $447,858 |
| 29 | VOA Associates | $425,000 |
| 30 | KZF Design | $417,500 |
| 31 | NORR | $410,487 |
| 32 | Moody Nolan | $361,308 |
| 33 | Hammel, Green and Abrahamson | $356,579 |
| 34 | Symmes Maini & McKee Associates | $330,000 |
| 35 | Corgan | $301,658 |
| 36 | Inventure Design Group | $267,111 |
| 37 | MBH Architects | $250,000 |
| 38 | Nelson | $200,905 |
| 39 | Perkins+will | $200,000 |
| 40 | ZGF Architects | $166,599 |
| 41 | FGM Architects | $151,212 |
| 42 | Poskanzer Skott | $150,000 |
| 43 | Wight & Company | $148,000 |
| 44 | Eppstein Uhen Architects | $129,099 |
| 45 | TEG Architects | $116,895 |
| 46 | S/L/A/M Collaborative, The | $100,899 |
| 47 | ai Design Group | $96,174 |
| 48 | Margulies Perruzzi Architects | $54,933 |
| 49 | Parkhill, Smith & Cooper | $54,000 |
| 50 | Hoffmann Architects | $51,000 |
| 51 | CASCO Diversified Corp. | $50,000 |
| 52 | Becker Morgan Group | $37,128 |
| 53 | Emersion Design | $27,353 |
| 54 | BRPH | $21,359 |
| 55 | Nadel | $20,000 |
| 56 | SchenkelShultz Architecture | $9,000 |
| 57 | NAC|Architecture | $5,805 |
| 58 | Mithun | $5,000 |
Top Industrial Sector Engineering Firms
| Rank | Company | 2013 Industrial Facility Revenue |
| 1 | Jacobs | $2,454,640,000 |
| 2 | Fluor Corporation | $978,710,000 |
| 3 | Day & Zimmermann | $130,576,072 |
| 4 | Leidos | $128,150,000 |
| 5 | SSOE Group | $103,744,174 |
| 6 | CRB | $86,164,350 |
| 7 | Burns & McDonnell | $65,880,000 |
| 8 | URS Corp. | $25,229,129 |
| 9 | Barge Waggoner Sumner & Cannon | $22,600,000 |
| 10 | ThermalTech Engineering | $20,650,000 |
| 11 | Affiliated Engineers | $14,967,000 |
| 12 | Parsons Brinckerhoff | $13,887,018 |
| 13 | Hixson Architecture, Engineering, Interiors | $12,000,000 |
| 14 | Glumac | $11,608,629 |
| 15 | Coffman Engineers | $8,485,055 |
| 16 | Dewberry | $8,293,503 |
| 17 | Simpson Gumpertz & Heger | $6,990,000 |
| 18 | Shive-Hattery | $6,941,997 |
| 19 | STV | $6,087,000 |
| 20 | KJWW Engineering Consultants | $4,875,191 |
| 21 | I. C. Thomasson Associates | $4,700,000 |
| 22 | Wiss, Janney, Elstner Associates | $3,910,000 |
| 23 | Stanley Consultants | $3,879,745 |
| 24 | Graef | $3,784,315 |
| 25 | Zak Companies | $3,782,825 |
| 26 | Arup | $2,883,064 |
| 27 | Magnusson Klemencic Associates | $2,795,955 |
| 28 | Guernsey | $2,726,472 |
| 29 | Martin/Martin | $2,446,592 |
| 30 | RMF Engineering | $2,425,000 |
| 31 | H.F. Lenz | $2,170,130 |
| 32 | P2S Engineering | $2,155,234 |
| 33 | M/E Engineering | $2,067,101 |
| 34 | Highland Associates | $2,000,000 |
| 35 | Paulus, Sokolowski and Sartor | $1,500,000 |
| 36 | Smith Seckman Reid | $1,379,596 |
| 37 | Vanderweil Engineers | $1,359,000 |
| 38 | Walter P Moore and Associates | $1,316,496 |
| 39 | Wallace Engineering | $1,219,000 |
| 40 | Aon Fire Protection Engineering Corp. | $1,150,000 |
| 41 | Bridgers & Paxton Consulting Engineers | $950,537 |
| 42 | Wick Fisher White | $945,203 |
| 43 | AKF Group | $863,000 |
| 44 | Karpinski Engineering | $796,700 |
| 45 | Thornton Tomasetti | $731,262 |
| 46 | Spectrum Engineers | $637,074 |
| 47 | Henderson Engineers | $619,216 |
| 48 | RDK Engineers | $610,000 |
| 49 | CJL Engineering | $552,450 |
| 50 | WSP Group | $470,000 |
| 51 | Interface Engineering | $461,622 |
| 52 | CTLGroup | $450,000 |
| 53 | Fishbeck, Thompson, Carr & Huber | $400,000 |
| 54 | Dunham Associates | $335,000 |
| 55 | Kamm Consulting | $306,791 |
| 56 | GHT Limited | $300,000 |
| 57 | TLC Engineering for Architecture | $276,713 |
| 58 | French & Parrello Associates | $269,000 |
| 59 | OLA Consulting Engineers | $257,000 |
| 60 | Apogee Consulting Group | $215,365 |
| 61 | M-E Engineers | $200,000 |
| 62 | KCI Technologies | $200,000 |
| 63 | Environmental Systems Design | $164,829 |
| 64 | G&W Engineering Corp. | $108,900 |
| 65 | Total Building Commissioning | $90,558 |
| 66 | Allen & Shariff | $80,000 |
| 67 | Davis, Bowen & Friedel | $59,236 |
| 68 | Heapy Engineering | $33,420 |
| 69 | GRW | $32,000 |
| 70 | Newcomb & Boyd | $28,562 |
| 71 | Mazzetti | $25,844 |
| 72 | Brinjac Engineering | $4,137 |
Top Industrial Sector Construction Firms
| Rank | Company | 2013 Industrial Facility Revenue |
| 1 | Turner Construction | $1,471,110,000 |
| 2 | Hoffman Construction | $1,202,000,000 |
| 3 | Walbridge | $929,200,000 |
| 4 | Yates Companies, The | $733,300,000 |
| 5 | Skanska USA | $689,994,679 |
| 6 | Gray Construction | $603,600,000 |
| 7 | Haskell | $454,396,992 |
| 8 | Clayco | $437,700,000 |
| 9 | Barton Malow | $435,381,455 |
| 10 | Gilbane | $337,445,270 |
| 11 | Whiting-Turner Contracting Co., The | $309,171,329 |
| 12 | Boldt Company, The | $283,320,400 |
| 13 | Brasfield & Gorrie | $246,596,893 |
| 14 | McShane Companies, The | $207,632,355 |
| 15 | Alberici Constructors | $205,875,885 |
| 16 | Ryan Companies US | $168,024,936 |
| 17 | McCarthy Holdings | $156,000,000 |
| 18 | Weitz Company, The | $149,150,605 |
| 19 | Tutor Perini Corp. | $138,266,084 |
| 20 | Hill & Wilkinson | $112,161,000 |
| 21 | Layton Construction | $111,400,000 |
| 22 | Graycor | $111,011,639 |
| 23 | Choate Construction | $97,994,926 |
| 24 | Hunt Construction Group | $78,000,000 |
| 25 | Hensel Phelps | $74,840,000 |
| 26 | EMJ Corp. | $72,000,000 |
| 27 | Pepper Construction | $66,570,000 |
| 28 | B. L. Harbert International | $59,035,052 |
| 29 | Robins & Morton | $58,297,183 |
| 30 | BlueScope Construction | $57,882,134 |
| 31 | Hoar Construction | $44,246,000 |
| 32 | C.W. Driver | $42,000,000 |
| 33 | Leopardo Companies | $40,981,704 |
| 34 | Messer Construction | $36,250,600 |
| 35 | S. M. Wilson & Co. | $34,384,608 |
| 36 | LeChase Construction Services | $32,800,000 |
| 37 | Lend Lease | $31,576,000 |
| 38 | Power Construction | $31,000,000 |
| 39 | McGough | $30,000,000 |
| 40 | JE Dunn Construction | $27,003,412 |
| 41 | Hathaway Dinwiddie Construction | $27,000,000 |
| 42 | O'Neil Industries/W.E. O'Neil | $25,322,275 |
| 43 | IMC Construction | $25,053,600 |
| 44 | Walsh Group, The | $21,687,693 |
| 45 | DPR Construction | $21,478,896 |
| 46 | New South Construction | $21,171,000 |
| 47 | Adolfson & Peterson Construction | $20,989,300 |
| 48 | Balfour Beatty US | $20,923,086 |
| 49 | HITT Contracting | $20,400,000 |
| 50 | Hill International | $17,000,000 |
| 51 | Coakley & Williams Construction | $16,557,262 |
| 52 | Parsons Brinckerhoff | $13,887,018 |
| 53 | Batson-Cook | $13,716,852 |
| 54 | Austin Commercial | $13,378,823 |
| 55 | CORE Construction Group | $12,445,450 |
| 56 | LPCiminelli | $11,931,788 |
| 57 | PCL Construction | $11,470,039 |
| 58 | JLL | $7,062,800 |
| 59 | STV | $6,087,000 |
| 60 | Beck Group, The | $5,624,708 |
| 61 | EBCO General Contractor | $5,611,000 |
| 62 | Heery International | $5,373,672 |
| 63 | James McHugh Construction | $5,304,373 |
| 64 | Holder Construction | $4,321,000 |
| 65 | Bernards | $4,000,000 |
| 66 | KBE Building Corp. | $3,465,079 |
| 67 | W. M. Jordan Company | $2,859,431 |
| 68 | Manhattan Construction | $2,154,000 |
| 69 | Stalco Construction | $1,890,000 |
| 70 | Wight & Company | $903,000 |
| 71 | Allen & Shariff | $80,000 |
| 72 | Astorino | $21,243 |
| 73 | Kitchell Corp. | $15,329 |
Read BD+C's full 2014 Giants 300 Report
Related Stories
| Nov 11, 2010
USGBC certifies more than 1 billion square feet of commercial space
This month, the total footprint of commercial projects certified under the U.S. Green Building Council’s LEED Green Building Rating System surpassed one billion square feet. Another six billion square feet of projects are registered and currently working toward LEED certification around the world. Since 2000, more than 36,000 commercial projects and 38,000 single-family homes have participated in LEED.

| Nov 10, 2010
$700 million plan to restore the National Mall
The National Mall—known as America’s front yard—is being targeted for a massive rehab and restoration that could cost as much as $700 million (it’s estimated that the Mall has $400 million in deferred maintenance alone). A few of the proposed projects: refurbishing the Grant Memorial, replacing the Capitol Reflecting Pool with a smaller pool or fountain, reconstructing the Constitution Gardens lake and constructing a multipurpose visitor center, and replacing the Sylvan Theater near the Washington Monument with a new multipurpose facility.
| Nov 9, 2010
Just how green is that college campus?
The College Sustainability Report Card 2011 evaluated colleges and universities in the U.S. and Canada with the 300 largest endowments—plus 22 others that asked to be included in the GreenReportCard.org study—on nine categories, including climate change, energy use, green building, and investment priorities. More than half (56%) earned a B or better, but 6% got a D. Can you guess which is the greenest of these: UC San Diego, Dickinson College, University of Calgary, and Dartmouth? Hint: The Red Devil has turned green.

| Nov 9, 2010
12 incredible objects being made with 3D printers today
BD+C has reported on how 3D printers are attracting the attention of AEC firms. Now you can see how other creative types are utilizing this fascinating printing technology. Among the printed items: King Tut’s remains, designer shoes, and the world’s smallest Rubik’s Cube.
| Nov 9, 2010
U.S. Army steps up requirements for greening building
Cool roofs, solar water heating, and advanced metering are among energy-efficiency elements that will have to be used in new permanent Army buildings in the U.S. and abroad starting in FY 2013. Designs for new construction and major renovations will incorporate sustainable design and development principles contained in ASHRAE 189.1.

| Nov 9, 2010
Designing a library? Don’t focus on books
How do you design a library when print books are no longer its core business? Turn them into massive study halls. That’s what designers did at the University of Amsterdam, where they transformed the existing 27,000-sf library into a study center—without any visible books. About 2,000 students visit the facility daily and encounter workspaces instead of stacks.
| Nov 9, 2010
Turner Construction report: Green buildings still on the agenda
Green buildings continue to be on the agenda for real estate owners, developers, and corporate owner-occupants, according to the Turner 2010 Green Building Market Barometer. Key findings: Almost 90% of respondents said it was extremely or very likely they would incorporate energy-efficiency improvements in their new construction or renovation project, and 60% expected to incorporate improvements to water efficiency, indoor environmental quality, and green materials.

| Nov 5, 2010
New Millennium’s Gary Heasley on BIM, LEED, and the nonresidential market
Gary Heasley, president of New Millennium Building Systems, Fort Wayne, Ind., and EVP of its parent company, Steel Dynamics, Inc., tells BD+C’s Robert Cassidy about the Steel Joist Manufacturer’s westward expansion, its push to create BIM tools for its products, LEED, and the outlook for the nonresidential construction market.
| Nov 3, 2010
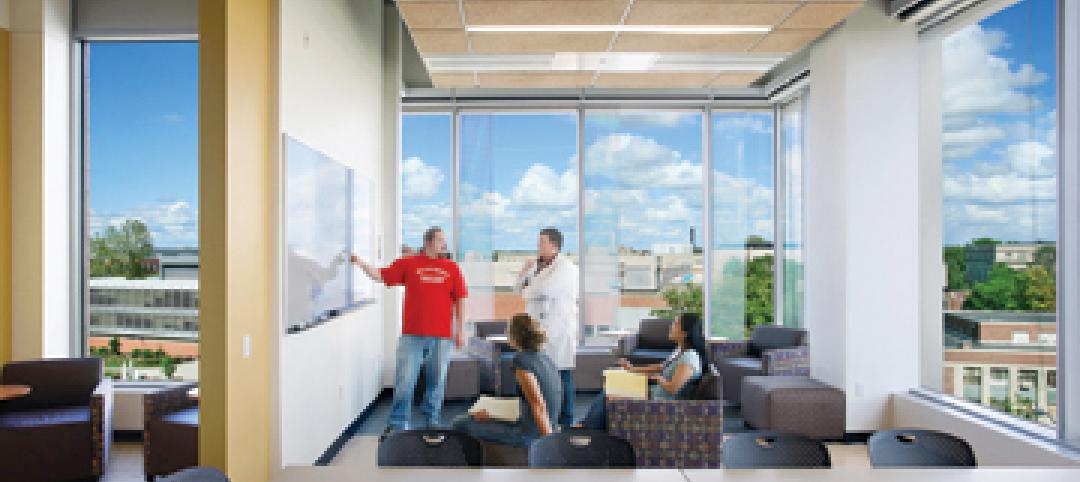
First of three green labs opens at Iowa State University
Designed by ZGF Architects, in association with OPN Architects, the Biorenewable Research Laboratory on the Ames campus of Iowa State University is the first of three projects completed as part of the school’s Biorenewables Complex. The 71,800-sf LEED Gold project is one of three wings that will make up the 210,000-sf complex.
| Nov 3, 2010
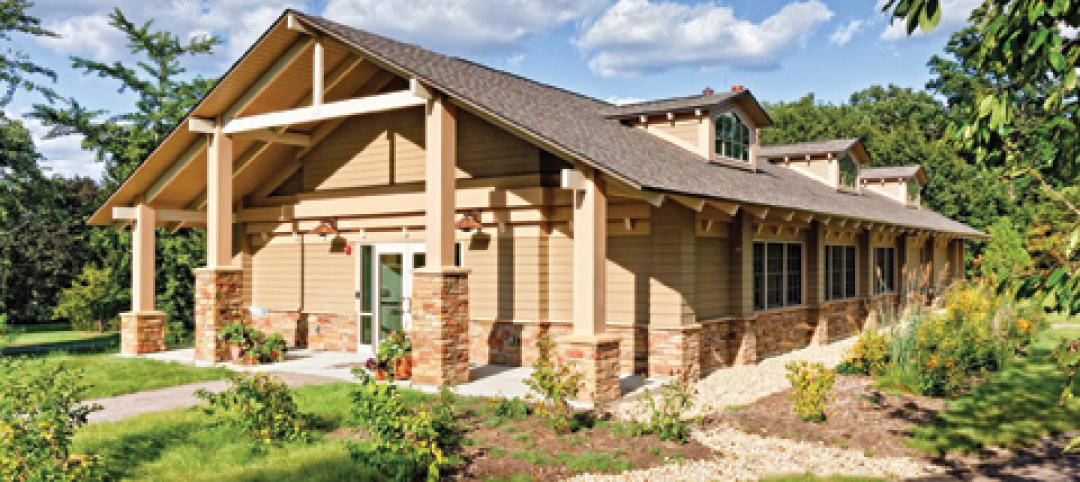
Park’s green education center a lesson in sustainability
The new Cantigny Outdoor Education Center, located within the 500-acre Cantigny Park in Wheaton, Ill., earned LEED Silver. Designed by DLA Architects, the 3,100-sf multipurpose center will serve patrons of the park’s golf courses, museums, and display garden, one of the largest such gardens in the Midwest.


