


Top Federal Government Sector Architecture Firms
| Rank | Company | 2013 Federal Government Revenue |
| 1 | HOK | $47,560,343 |
| 2 | Skidmore, Owings & Merrill | $37,408,986 |
| 3 | Gensler | $37,375,358 |
| 4 | Page | $35,000,000 |
| 5 | EYP Architecture & Engineering | $29,000,000 |
| 6 | SmithGroupJJR | $24,455,805 |
| 7 | Stantec | $19,626,705 |
| 8 | HDR | $17,302,494 |
| 9 | Heery International | $16,882,588 |
| 10 | CannonDesign | $12,000,000 |
| 11 | Perkins+will | $11,496,367 |
| 12 | ZGF Architects | $11,276,439 |
| 13 | Westlake Reed Leskosky | $8,349,000 |
| 14 | Davis Brody Bond | $8,263,108 |
| 15 | RTKL Associates | $7,688,000 |
| 16 | RS&H | $7,350,000 |
| 17 | NORR | $6,874,000 |
| 18 | EwingCole | $6,400,000 |
| 19 | Hammel, Green and Abrahamson | $6,214,238 |
| 20 | Clark Nexsen | $5,884,695 |
| 21 | IBI Group ? Gruzen Samton | $5,000,000 |
| 22 | Beyer Blinder Belle | $4,661,897 |
| 23 | Epstein | $3,964,000 |
| 24 | HNTB Corp. | $3,717,741 |
| 25 | CTA Architects Engineers | $3,470,090 |
| 26 | Leo A Daly | $3,372,835 |
| 27 | WDG Architecture | $3,095,000 |
| 28 | Flad Architects | $2,739,552 |
| 29 | Solomon Cordwell Buenz | $2,500,000 |
| 30 | NBBJ | $1,451,000 |
| 31 | LBL Architects | $1,400,000 |
| 32 | Good Fulton & Farrell | $1,241,500 |
| 33 | Morris Architects | $1,200,000 |
| 34 | Moody Nolan | $1,083,924 |
| 35 | Cooper Carry | $1,046,536 |
| 36 | Swanke Hayden Connell Architects | $1,021,000 |
| 37 | GWWO | $886,694 |
| 38 | Hoffmann Architects | $870,000 |
| 39 | Lord Aeck Sargent | $742,273 |
| 40 | HKS | $477,931 |
| 41 | Schrader Group Architecture | $475,040 |
| 42 | Parkhill, Smith & Cooper | $464,000 |
| 43 | BRPH | $390,000 |
| 44 | Ratio Architects | $345,532 |
| 45 | VOA Associates | $329,883 |
| 46 | Fentress Architects | $321,200 |
| 47 | LS3P | $311,393 |
| 48 | OZ Architecture | $275,293 |
| 49 | Bergmann Associates | $250,000 |
| 50 | Emersion Design | $225,298 |
| 51 | Baskervill | $133,457 |
| 52 | Hoefer Wysocki Architecture | $125,000 |
| 53 | Smallwood, Reynolds, Stewart, Stewart & Associates | $118,806 |
| 54 | KZF Design | $76,500 |
| 55 | Symmes Maini & McKee Associates | $28,000 |
| 56 | Ennead Architects | $23,000 |
| 57 | RSP Architects | $4,000 |
Top Federal Government Sector Engineering Firms
| Rank | Company | 2013 Federal Government Revenue |
| 1 | Fluor Corporation | $1,087,817,641 |
| 2 | URS Corp. | $147,723,075 |
| 3 | Jacobs | $123,094,151 |
| 4 | AECOM Technology Corp. | $120,000,000 |
| 5 | Burns & McDonnell | $51,310,000 |
| 6 | H&A Architects & Engineers | $34,500,000 |
| 7 | Parsons Brinckerhoff | $29,856,632 |
| 8 | Affiliated Engineers | $7,267,000 |
| 9 | Bridgers & Paxton Consulting Engineers | $5,865,893 |
| 10 | Dewberry | $5,772,479 |
| 11 | RMF Engineering | $3,500,000 |
| 12 | Arup | $3,149,969 |
| 13 | WSP Group | $3,040,000 |
| 14 | Thornton Tomasetti | $2,696,487 |
| 15 | Interface Engineering | $2,659,451 |
| 16 | Degenkolb Engineers | $2,487,894 |
| 17 | KJWW Engineering Consultants | $2,481,431 |
| 18 | GRW | $1,602,675 |
| 19 | KPFF Consulting Engineers | $1,500,000 |
| 20 | Simpson Gumpertz & Heger | $1,460,000 |
| 21 | TTG | $1,406,850 |
| 22 | Glumac | $1,332,608 |
| 23 | STV | $1,269,000 |
| 24 | Guernsey | $1,252,705 |
| 25 | Wiss, Janney, Elstner Associates | $1,220,000 |
| 26 | GHT Limited | $1,200,000 |
| 27 | Syska Hennessy Group | $1,185,591 |
| 28 | Coffman Engineers | $1,185,439 |
| 29 | H.F. Lenz | $1,118,398 |
| 30 | Vanderweil Engineers | $1,071,900 |
| 31 | M/E Engineering | $1,032,258 |
| 32 | Walter P Moore and Associates | $1,029,902 |
| 33 | Rist-Frost-Shumway Engineering | $1,000,000 |
| 34 | RDK Engineers | $990,000 |
| 35 | I. C. Thomasson Associates | $900,000 |
| 36 | Spectrum Engineers | $861,801 |
| 37 | SSOE Group | $843,603 |
| 38 | Henderson Engineers | $774,752 |
| 39 | Newcomb & Boyd | $578,946 |
| 40 | Allen & Shariff | $500,000 |
| 41 | Environmental Systems Design | $498,548 |
| 42 | Walker Parking Consultants | $425,000 |
| 43 | Highland Associates | $300,000 |
| 44 | Davis, Bowen & Friedel | $264,645 |
| 45 | Barge Waggoner Sumner & Cannon | $200,000 |
| 46 | Shive-Hattery | $178,908 |
| 47 | Ross & Baruzzini | $147,267 |
| 48 | TLC Engineering for Architecture | $117,974 |
| 49 | KCI Technologies | $100,000 |
| 50 | P2S Engineering | $99,369 |
| 51 | AKF Group | $84,000 |
| 52 | Brinjac Engineering | $56,607 |
| 53 | Sparling | $55,526 |
| 54 | Total Building Commissioning | $50,225 |
| 55 | Apogee Consulting Group | $45,500 |
| 56 | Aon Fire Protection Engineering Corp. | $19,100 |
| 57 | G&W Engineering Corp. | $15,100 |
| 58 | Mazzetti | $12,130 |
Top Federal Government Sector Construction Firms
| Rank | Company | 2013 Federal Government Revenue |
| 1 | Clark Group | $416,076,471 |
| 2 | Hensel Phelps | $228,520,000 |
| 3 | PCL Construction | $201,514,671 |
| 4 | Whiting-Turner Contracting Co., The | $185,570,898 |
| 5 | Walsh Group, The | $183,464,442 |
| 6 | Gilbane | $125,163,000 |
| 7 | Balfour Beatty US | $90,050,753 |
| 8 | HITT Contracting | $87,540,000 |
| 9 | Turner Construction | $82,532,901 |
| 10 | McCarthy Holdings | $81,000,000 |
| 11 | Tutor Perini Corp. | $73,441,174 |
| 12 | James G. Davis Construction | $72,010,706 |
| 13 | Yates Companies, The | $67,800,000 |
| 14 | DPR Construction | $65,374,246 |
| 15 | Sundt Construction | $56,670,630 |
| 16 | Ryan Companies US | $53,582,216 |
| 17 | JE Dunn Construction | $52,662,171 |
| 18 | Swinerton Builders | $45,394,000 |
| 19 | Beck Group, The | $33,303,078 |
| 20 | Barton Malow | $33,108,673 |
| 21 | Flintco | $33,037,906 |
| 22 | Mortenson Construction | $32,400,000 |
| 23 | Parsons Brinckerhoff | $29,856,632 |
| 24 | Hathaway Dinwiddie Construction | $29,000,000 |
| 25 | Structure Tone | $23,984,800 |
| 26 | Consigli Construction | $23,829,766 |
| 27 | Hoar Construction | $18,377,000 |
| 28 | Skanska USA | $17,349,157 |
| 29 | Heery International | $16,882,588 |
| 30 | Harkins Builders | $16,400,000 |
| 31 | Hoffman Construction | $15,330,600 |
| 32 | Lend Lease | $13,347,000 |
| 33 | New South Construction | $11,598,000 |
| 34 | Hill International | $11,000,000 |
| 35 | S. M. Wilson & Co. | $10,383,344 |
| 36 | Hunt Companies | $10,075,000 |
| 37 | Power Construction | $5,000,000 |
| 38 | Messer Construction | $4,702,940 |
| 39 | LPCiminelli | $4,555,360 |
| 40 | KBE Building Corp. | $3,176,237 |
| 41 | Suffolk Construction | $2,000,000 |
| 42 | JLL | $1,800,000 |
| 43 | W. M. Jordan Company | $1,572,036 |
| 44 | Coakley & Williams Construction | $1,362,589 |
| 45 | STV | $1,269,000 |
| 46 | Brasfield & Gorrie | $1,101,283 |
| 47 | Absher Construction | $1,003,288 |
| 48 | BlueScope Construction | $978,132 |
| 49 | Allen & Shariff | $500,000 |
| 50 | Haselden Construction | $379,799 |
| 51 | Graycor | $349,215 |
| 52 | Astorino | $127,393 |
| 53 | Manhattan Construction | $8,978 |
Read BD+C's full 2014 Giants 300 Report
Related Stories
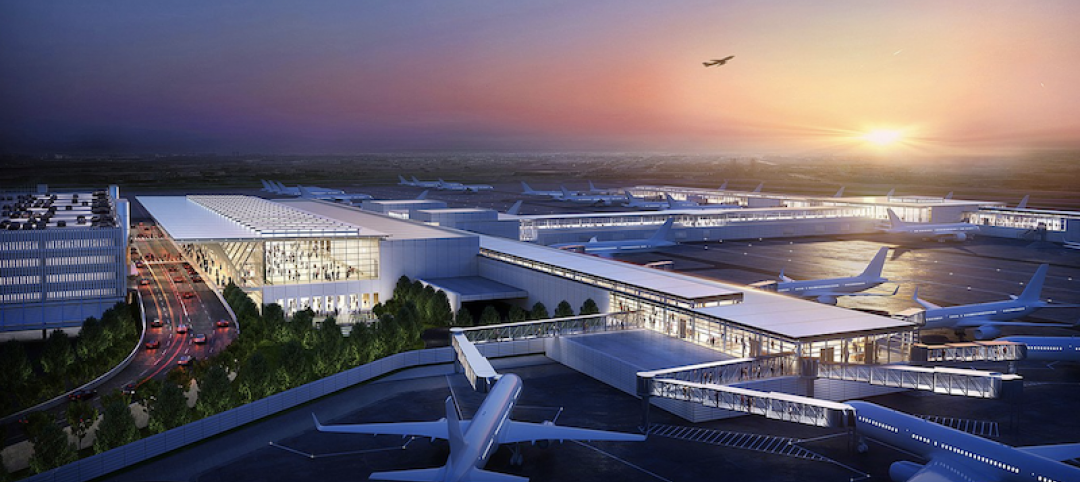
Airports | Aug 13, 2021
Kansas City International Airport’s new terminal breaks ground
SOM designed the project.

Airports | Jul 26, 2021
NORR designs the UK’s first satellite launch Space Hub
The project will be located in Sutherland, Scotland.

Wood | Jul 16, 2021
The future of mass timber construction, with Swinerton's Timberlab
In this exclusive for HorizonTV, BD+C's John Caulfield sat down with three Timberlab leaders to discuss the launch of the firm and what factors will lead to greater mass timber demand.
![Oceanographer John Englander talks resiliency and buildings [new on HorizonTV]](/sites/default/files/styles/list_big/public/Oceanographer%20John%20Englander%20Talks%20Resiliency%20and%20Buildings%20YT%20new_0.jpg?itok=enJ1TWJ8 "Oceanographer John Englander talks resiliency and buildings [new on HorizonTV]")
Resiliency | Jun 24, 2021
Oceanographer John Englander talks resiliency and buildings [new on HorizonTV]
New on HorizonTV, oceanographer John Englander discusses his latest book, which warns that, regardless of resilience efforts, sea levels will rise by meters in the coming decades. Adaptation, he says, is the key to future building design and construction.
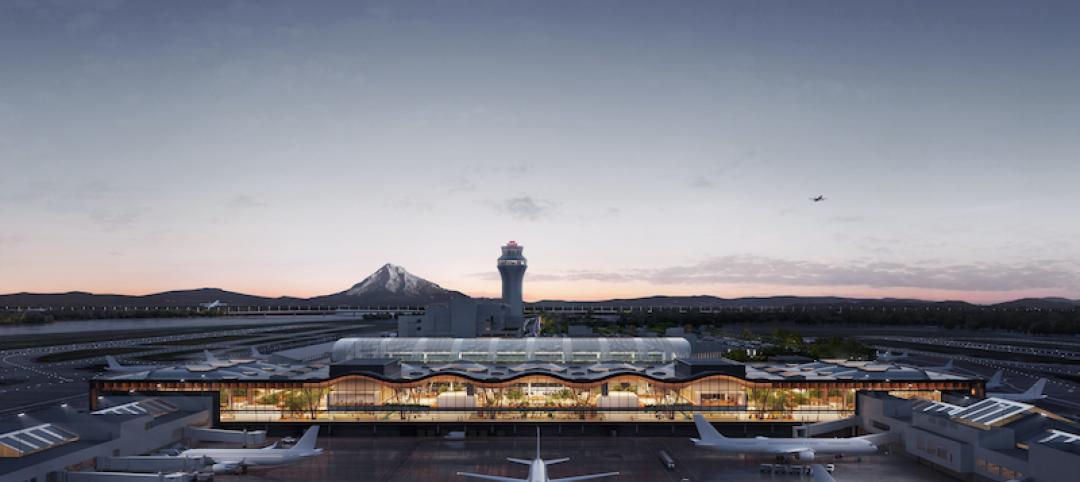
Airports | Jun 9, 2021
ZGF unveils latest renderings of Portland International Airport’s main terminal
An undulating wooden roof highlights the project.
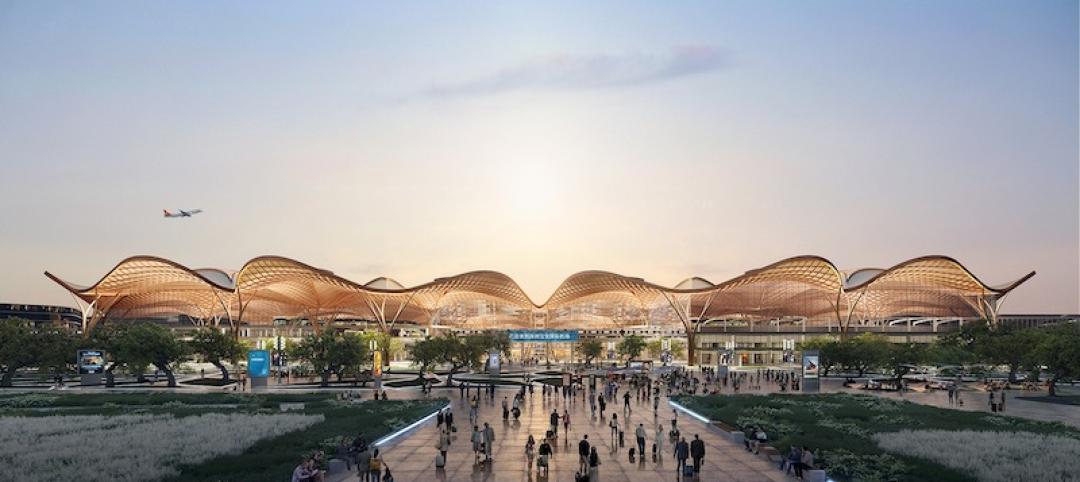
Airports | May 27, 2021
Grimshaw wins competition to design Shenzhen Airport East Integrated Transport Hub
The competition sought to find a design that created an integrated intermodal transport hub that could act as a new urban gateway.

Digital Twin | May 24, 2021
Digital twin’s value propositions for the built environment, explained
Ernst & Young’s white paper makes its cases for the technology’s myriad benefits.

Multifamily Housing | Mar 28, 2021
Smart home technology 101 for multifamily housing communities
Bulk-services Wi-Fi leads to better connectivity, products, and services to help multifamily developers create greater value for residents–and their own bottom line.

Market Data | Feb 24, 2021
2021 won’t be a growth year for construction spending, says latest JLL forecast
Predicts second-half improvement toward normalization next year.

Airports | Jan 26, 2021
Security concerns will drive demand for airport technology over the next five years
A new report explores where and what spending for “smart” airports is likely to focus on.


