


Unprecedented price increases for a wide range of goods and services used in construction pushed up contractors’ costs by a devastating 26.3% from June 2020 to June 2021, according to an analysis by the Associated General Contractors of America of government data released today. Association officials cautioned that rising materials prices are making it difficult for many construction firms to benefit from the re-opening of the economy, undermining the sector’s ability to add new, high-paying jobs.
“Contractors have been pummeled in the past year by cost increases, supply shortages, and transport bottlenecks,” said Ken Simonson, the association’s chief economist. “Meanwhile, falling demand for many types of projects meant contractors could not raise bid prices enough to recoup these expenses.”
The producer price index for new nonresidential construction—a measure of what contractors say they would charge to erect five types of nonresidential buildings—rose only 3.4% over the past 12 months. That was a small fraction of the 26.3% increase in the prices that producers and service providers such as distributors and transportation firms charged for construction inputs, Simonson noted.
There were double-digit percentage increases in the selling prices of materials used in every type of construction. The producer price index for lumber and plywood doubled from June 2020 to last month, although prices for lumber have declined since the index was computed. The index for steel mill products climbed 87.5%, while the index for copper and brass mill shapes rose 61.5% and the index for aluminum mill shapes increased 33.2%. The index for plastic construction products rose 21.8%. The index for gypsum products such as wallboard climbed 18.0%. The index for prepared asphalt and tar roofing and siding products climbed 12.1%, while the index for insulation materials rose 10.1%.
In addition to increases in materials costs, transportation and fuel costs also spiked. The index for truck transportation of freight jumped 15.4%. Fuel costs, which contractors pay directly to operate their own trucks and off-road equipment, as well as through surcharges on freight deliveries, have also jumped.
Association officials urged Congress and the Biden administration to act quickly to address rising materials prices. They repeated their calls for the president to remove tariffs on key construction materials, including steel and aluminum. They also urged Washington officials to explore other short-term steps needed to improve the supply chain for key construction materials.
“Construction firms will have a hard time adding new staff while they are paying more and more for many of the products they need to build projects,” said Stephen E. Sandherr, the association’s chief executive officer. “Washington officials can take steps that are likely to have an almost immediate impact on materials prices, but they need to act.”
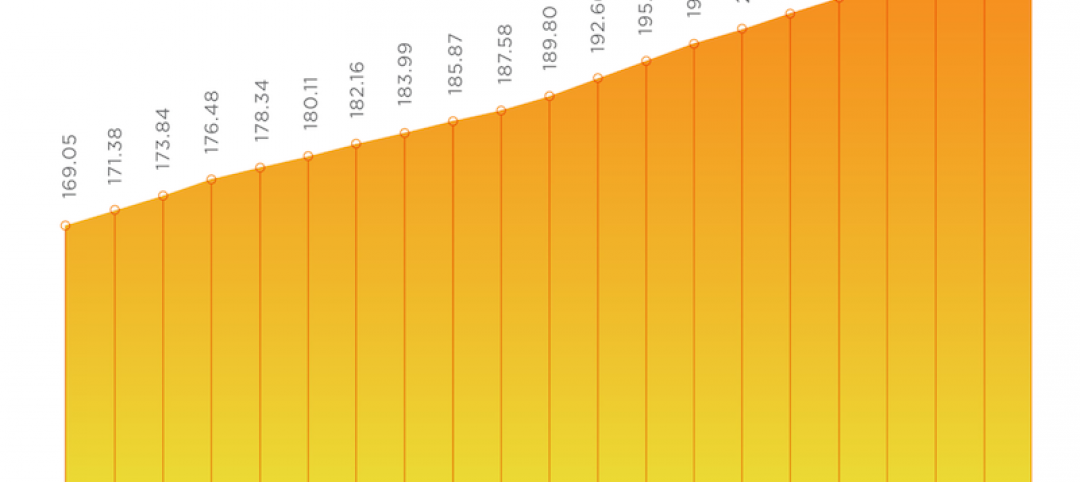
View producer price index data. View chart of gap between input costs and bid prices.
Related Stories

Market Data | Jan 29, 2021
The U.S. hotel construction pipeline stands at 5,216 projects/650,222 rooms at year-end 2020
At the end of Q4 ‘20, projects currently under construction stand at 1,487 projects/199,700 rooms.

Multifamily Housing | Jan 27, 2021
2021 multifamily housing outlook: Dallas, Miami, D.C., will lead apartment completions
In its latest outlook report for the multifamily rental market, Yardi Matrix outlined several reasons for hope for a solid recovery for the multifamily housing sector in 2021, especially during the second half of the year.

Market Data | Jan 26, 2021
Construction employment in December trails pre-pandemic levels in 34 states
Texas and Vermont have worst February-December losses while Virginia and Alabama add the most.

Market Data | Jan 19, 2021
Architecture Billings continue to lose ground
The pace of decline during December accelerated from November.

Market Data | Jan 19, 2021
2021 construction forecast: Nonresidential building spending will drop 5.7%, bounce back in 2022
Healthcare and public safety are the only nonresidential construction sectors that will see growth in spending in 2021, according to AIA's 2021 Consensus Construction Forecast.

Market Data | Jan 13, 2021
Atlanta, Dallas seen as most favorable U.S. markets for commercial development in 2021, CBRE analysis finds
U.S. construction activity is expected to bounce back in 2021, after a slowdown in 2020 due to challenges brought by COVID-19.
Market Data | Jan 13, 2021
Nonres construction could be in for a long recovery period
Rider Levett Bucknall’s latest cost report singles out unemployment and infrastructure spending as barometers.

Market Data | Jan 13, 2021
Contractor optimism improves as ABC’s Construction Backlog inches up in December
ABC’s Construction Confidence Index readings for sales, profit margins, and staffing levels increased in December.

Market Data | Jan 11, 2021
Turner Construction Company launches SourceBlue Brand
SourceBlue draws upon 20 years of supply chain management experience in the construction industry.

Market Data | Jan 8, 2021
Construction sector adds 51,000 jobs in December
Gains are likely temporary as new industry survey finds widespread pessimism for 2021.


