


Nearly one-third of U.S. metro areas lost construction jobs between August 2020 and August 2021, according to an analysis by the Associated General Contractors of America of government employment data released today. Association officials noted that the job losses are occurring as the fate of a bipartisan infrastructure bill that would boost demand for construction remains uncertain in the U.S. House of Representatives.
“While construction activity has rebounded from pandemic lows in many metros, the recovery is fragile,” said Ken Simonson, the association’s chief economist. “Extreme production and delivery delays, along with continuing high materials costs, may lead to project cancellations and postponements that cut into job gains.”
Construction employment declined from a year earlier in 65 metros and held steady in 37. New York City lost the most jobs (-8,600 jobs or -6%), followed by Nassau County-Suffolk County, N.Y. (-5,100 jobs, -6%); Miami-Miami Beach-Kendall, Fla. (-3,200 jobs, -6%); Calvert-Charles-Prince George’s, Md. (-2,400 jobs, -7%) and Houston-The Woodlands-Sugar Land, Texas (-2,300 jobs, -1%). The largest percentage declines were in Evansville, Ind.-Ky. (-14%, -1,400 jobs); Tuscaloosa, Ala. (-12%, -800 jobs); Watertown-Fort Drum, N.Y. (-11%, -200 jobs); Morristown, Tenn. (-10%, -200 jobs); Victoria, Texas (-9%, -300 jobs) and Gadsden, Ala. (-9%, -100 jobs).
Construction employment increased in 256 out of 358 metro areas over the last 12 months. San Diego-Carlsbad, Calif. added the most construction jobs (8,900 jobs, 11%; followed by Sacramento-Roseville--Arden-
Association officials urged members of both parties in the House to vote for the bipartisan infrastructure bill, noting its new funding was needed to modernize the nation’s aging highways and transit systems. They noted the measure is slated for a vote this Thursday and cautioned that the industry was likely to lose more construction jobs without the measure.
“This is the kind of infrastructure bill that Democrats and Republicans have been promising to pass for years now,” said Stephen E. Sandherr, the association’s chief executive officer. “Failing to pass this measure will create new challenges for the economy.”
View the metro employment data, rankings, top 10, new highs and lows, and map.
Related Stories

Market Data | Apr 23, 2020
5 must reads for the AEC industry today: April 23, 2020
The death of the department store and how to return to work when the time comes.

Market Data | Apr 22, 2020
6 must reads for the AEC industry today: April 22, 2020
Repurposed containers can be used as rapid response airborne infection isolation rooms and virtual site visits help control infection on project sites.
Market Data | Apr 21, 2020
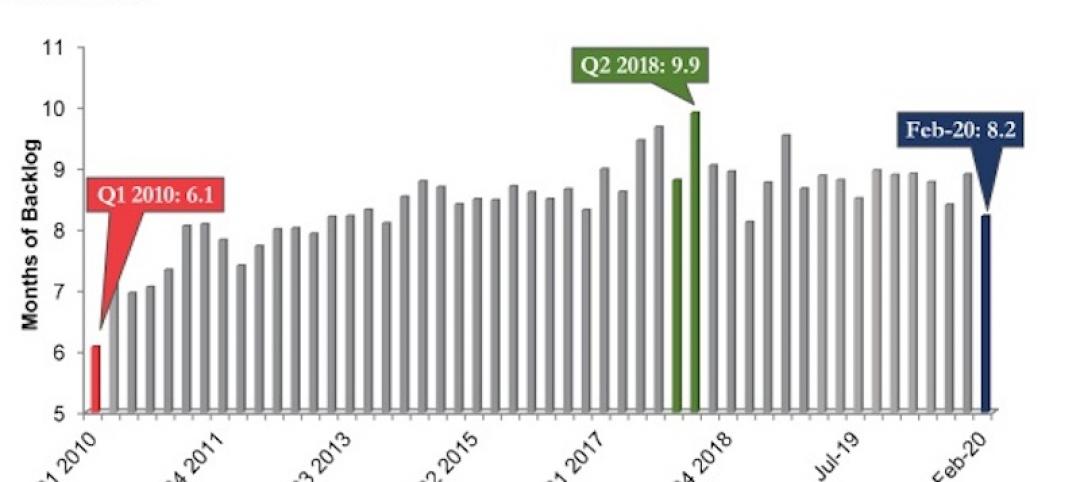
ABC's Construction Backlog Indicator down in February
Backlog for firms working in the infrastructure segment rose by 1.3 months in February while backlog for commercial and institutional and heavy industrial firms declined by 0.6 months and 0.7 months, respectively.

Market Data | Apr 21, 2020
5 must reads for the AEC industry today: April 21, 2020
IoT system helps contractors keep their distance and the multifamily market flattens.

Market Data | Apr 20, 2020
6 must reads for the AEC industry today: April 20, 2020
The continent's tallest living wall and NMHC survey shows significant delays in apartment construction.

Market Data | Apr 17, 2020
Construction employment declines in 20 states and D.C. in March, in line with industry survey showing growing job losses for the sector
New monthly job loss data foreshadows more layoffs amid project cancellations and state cutbacks in road projects as association calls for more small business relief and immediate aid for highway funding.

Market Data | Apr 17, 2020
5 must reads for the AEC industry today: April 17, 2020
Meet the 'AEC outsiders' pushing the industry forward and the world's largest Living Building.

Market Data | Apr 16, 2020
5 must reads for the AEC industry today: April 16, 2020
The SMPS Foundation and Building Design+Construction are studying the impact of the coronavirus pandemic on the ability to attain and retain clients and conduct projects and Saks Fifth Avenue plans a sanitized post-coronavirus opening.

Market Data | Apr 15, 2020
5 must reads for the AEC industry today: April 15, 2020
Buildings as "open source platforms" and 3D printing finds its grove producing face shields.

Market Data | Apr 14, 2020
6 must reads for the AEC industry today: April 14, 2020
A robot dog conducts site inspections and going to the library with little kids just got easier.


