


Nearly one-third of U.S. metro areas lost construction jobs between August 2020 and August 2021, according to an analysis by the Associated General Contractors of America of government employment data released today. Association officials noted that the job losses are occurring as the fate of a bipartisan infrastructure bill that would boost demand for construction remains uncertain in the U.S. House of Representatives.
“While construction activity has rebounded from pandemic lows in many metros, the recovery is fragile,” said Ken Simonson, the association’s chief economist. “Extreme production and delivery delays, along with continuing high materials costs, may lead to project cancellations and postponements that cut into job gains.”
Construction employment declined from a year earlier in 65 metros and held steady in 37. New York City lost the most jobs (-8,600 jobs or -6%), followed by Nassau County-Suffolk County, N.Y. (-5,100 jobs, -6%); Miami-Miami Beach-Kendall, Fla. (-3,200 jobs, -6%); Calvert-Charles-Prince George’s, Md. (-2,400 jobs, -7%) and Houston-The Woodlands-Sugar Land, Texas (-2,300 jobs, -1%). The largest percentage declines were in Evansville, Ind.-Ky. (-14%, -1,400 jobs); Tuscaloosa, Ala. (-12%, -800 jobs); Watertown-Fort Drum, N.Y. (-11%, -200 jobs); Morristown, Tenn. (-10%, -200 jobs); Victoria, Texas (-9%, -300 jobs) and Gadsden, Ala. (-9%, -100 jobs).
Construction employment increased in 256 out of 358 metro areas over the last 12 months. San Diego-Carlsbad, Calif. added the most construction jobs (8,900 jobs, 11%; followed by Sacramento-Roseville--Arden-
Association officials urged members of both parties in the House to vote for the bipartisan infrastructure bill, noting its new funding was needed to modernize the nation’s aging highways and transit systems. They noted the measure is slated for a vote this Thursday and cautioned that the industry was likely to lose more construction jobs without the measure.
“This is the kind of infrastructure bill that Democrats and Republicans have been promising to pass for years now,” said Stephen E. Sandherr, the association’s chief executive officer. “Failing to pass this measure will create new challenges for the economy.”
View the metro employment data, rankings, top 10, new highs and lows, and map.
Related Stories

Building Team | Jun 17, 2022
Data analytics in design and construction: from confusion to clarity and the data-driven future
Data helps virtual design and construction (VDC) teams predict project risks and navigate change, which is especially vital in today’s fluctuating construction environment.

Market Data | Jun 15, 2022
ABC’s construction backlog rises in May; contractor confidence falters
Associated Builders and Contractors reports today that its Construction Backlog Indicator increased to nine months in May from 8.8 months in April, according to an ABC member survey conducted May 17 to June 3. The reading is up one month from May 2021.

Market Data | May 18, 2022
Architecture Billings Index moderates slightly, remains strong
For the fifteenth consecutive month architecture firms reported increasing demand for design services in April, according to a new report today from The American Institute of Architects (AIA).

Market Data | May 12, 2022
Monthly construction input prices increase in April
Construction input prices increased 0.8% in April compared to the previous month, according to an Associated Builders and Contractors analysis of U.S. Bureau of Labor Statistics’ Producer Price Index data released today.

Market Data | May 10, 2022
Hybrid work could result in 20% less demand for office space
Global office demand could drop by between 10% and 20% as companies continue to develop policies around hybrid work arrangements, a Barclays analyst recently stated on CNBC.

Market Data | May 6, 2022
Nonresidential construction spending down 1% in March
National nonresidential construction spending was down 0.8% in March, according to an Associated Builders and Contractors analysis of data published today by the U.S. Census Bureau.
Market Data | Apr 29, 2022
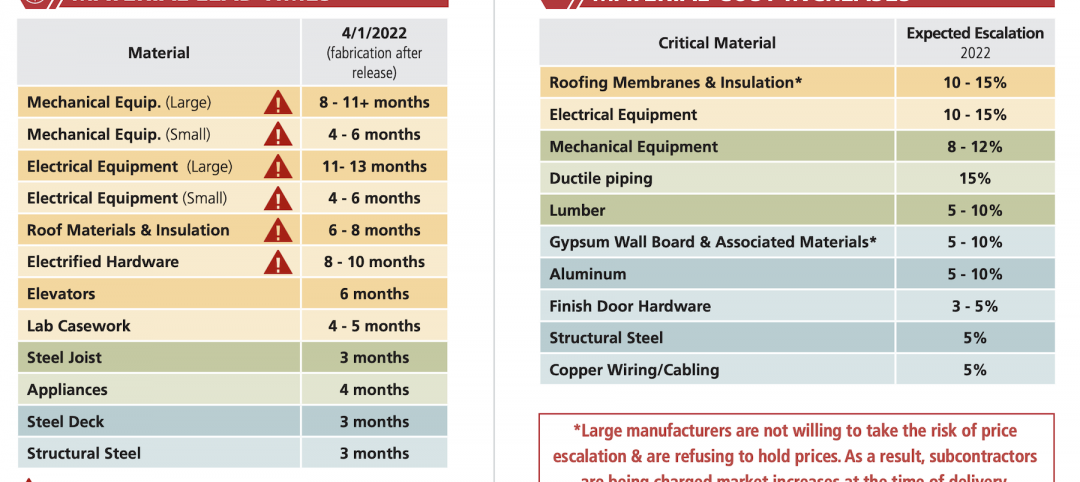
Global forces push construction prices higher
Consigli’s latest forecast predicts high single-digit increases for this year.

Market Data | Apr 29, 2022
U.S. economy contracts, investment in structures down, says ABC
The U.S. economy contracted at a 1.4% annualized rate during the first quarter of 2022.

Market Data | Apr 20, 2022
Pace of demand for design services rapidly accelerates
Demand for design services in March expanded sharply from February according to a new report today from The American Institute of Architects (AIA).

Market Data | Apr 14, 2022
FMI 2022 construction spending forecast: 7% growth despite economic turmoil
Growth will be offset by inflation, supply chain snarls, a shortage of workers, project delays, and economic turmoil caused by international events such as the Russia-Ukraine war.


