


The office market continues to improve, with many projects in development. Rents are rising as vacancy decreases, according to Jones Lang LaSalle’s 2014 U.S. Office Outlook (http://bit.ly/1ildrS7). Dozens of markets are classified as experiencing a “rising phase” (among them, Phoenix, Chicago, Salt Lake City, and Atlanta), while Dallas, Houston, San Francisco, and the Silicon Valley are believed to be peaking.
New-construction leaders include Houston and New York City, and even in calmer markets, AEC firms are busy with workplace fitouts and renovations.
The adage “doing more with less” has become a byword for many businesses since the Great Recession, and clients are trying to maximize every precious inch. “Everyone is looking to use less space,” says Daniel P. Perruzzi, Jr., AIA, LEED AP, Principal at Boston-based Margulies Perruzzi Architects. “They’re looking at ways to modify their office and workplace standards so that they can fit into less.”
Hierarchical office assignments are becoming passé, as is the notion that people will stay in their cubicles for much of the day. “A lot of companies are going down to a single size for offices, so they’re not awarding that space on the basis of rank,” notes Perruzzi. “And as a rule, companies are looking to change the ratio between offices and open workstations. It’s all driven by collaboration.”
Non-assigned space concepts continue to gain popularity. Whether or not they’re actual telecommuters, workers on the move require well-considered accommodations, including easily accessible plug-ins for laptops, tablets, and smartphones. Says Perruzzi, “You have to think about the accommodations both technically and physically. Workers want to be able to plug in their devices and see their desktop no matter which workstation they’re using.”
Analyses by experts like CoreNet Global indicate that space per worker may drop below 100 sf within five years. Perruzzi says workstations won’t necessarily keep shrinking but will likely keep reducing in number. Margulies Perruzzi’s design for Philips North America’s first Workplace Innovation Center involved no private offices and 200 physical workstations for about 260 employees. Called “free addressing,” the plan allows employees to migrate from desk to desk while reducing the number of empty spots left by workers who are off-site.
Says Perruzzi: “There’s no such thing as an individual contributor anymore. It’s about people working in teams that change on a regular basis, are very dynamic, and need constant access to each other.”
Top Office Sector Architecture Firms
| Rank | Company | 2013 Office Revenue |
| 1 | Gensler | $472,552,752 |
| 2 | HOK | 141,723,793 |
| 3 | Perkins+will | 112,815,842 |
| 4 | Skidmore, Owings & Merrill | 83,599,900 |
| 5 | NBBJ | 64,107,000 |
| 6 | Stantec | 62,594,213 |
| 7 | ZGF Architects | 43,902,072 |
| 8 | Page | 37,460,000 |
| 9 | Kohn Pedersen Fox Associates | 36,176,000 |
| 10 | Nelson | 36,089,550 |
| 11 | SmithGroupJJR | 35,614,366 |
| 12 | Hammel, Green and Abrahamson | 33,267,365 |
| 13 | RTKL Associates | 30,705,000 |
| 14 | EYP Architecture & Engineering | 30,000,000 |
| 15 | CannonDesign | 29,000,000 |
| 16 | HKS | 26,255,885 |
| 17 | Corgan | 24,977,990 |
| 18 | HDR | 24,700,000 |
| 19 | RSP Architects | 23,106,000 |
| 20 | Leo A Daly | 20,101,466 |
| 21 | Heery International | 20,011,958 |
| 22 | LS3P | 17,522,964 |
| 23 | Ware Malcomb | 17,500,000 |
| 24 | Kirksey | 15,989,864 |
| 25 | LPA | 15,875,503 |
| 26 | Perkins Eastman | 15,000,000 |
| 27 | NORR | 14,244,421 |
| 28 | Goettsch Partners | 12,070,000 |
| 29 | VOA Associates | 11,040,757 |
| 30 | Epstein | 10,752,000 |
| 31 | CTA Architects Engineers | 10,438,159 |
| 32 | Margulies Perruzzi Architects | 10,191,746 |
| 33 | Cuningham Group Architecture | 10,068,814 |
| 34 | BRPH | 9,906,000 |
| 35 | DLR Group | 9,800,000 |
| 36 | Environetics | 9,612,351 |
| 37 | Vocon | 9,203,152 |
| 38 | RNL | 8,941,000 |
| 39 | Gresham, Smith and Partners | 8,768,000 |
| 40 | Ziegler Cooper | 8,676,816 |
| 41 | Davis Brody Bond | 8,369,474 |
| 42 | FXFOWLE Architects | 7,880,000 |
| 43 | Adrian Smith + Gordon Gill Architecture | 7,750,000 |
| 44 | Clark Nexsen | 7,707,493 |
| 45 | LMN Architects | 7,368,900 |
| 46 | Little | 7,253,565 |
| 47 | Cooper Carry | 7,227,738 |
| 48 | Symmes Maini & McKee Associates | 6,490,000 |
| 49 | WDG Architecture | 5,844,000 |
| 50 | Solomon Cordwell Buenz | 5,300,000 |
| 51 | Carrier Johnson + Culture | 5,118,818 |
| 52 | Swanke Hayden Connell Architects | 4,990,000 |
| 53 | Eppstein Uhen Architects | 4,972,955 |
| 54 | Fentress Architects | 4,551,790 |
| 55 | Francis Cauffman | 4,187,463 |
| 56 | Wight & Company | 3,683,000 |
| 57 | Smallwood, Reynolds, Stewart, Stewart & Associates | 3,653,284 |
| 58 | OZ Architecture | 3,625,600 |
| 59 | GBBN Architects | 3,540,500 |
| 60 | Callison | 3,481,227 |
| 61 | HMC Architects | 3,388,658 |
| 62 | Albert Kahn Associates | 3,297,848 |
| 63 | Baskervill | 3,226,678 |
| 64 | Rule Joy Trammell + Rubio | 3,120,000 |
| 65 | Montroy Andersen DeMarco | 3,107,000 |
| 66 | Goodwyn Mills & Cawood | 2,932,849 |
| 67 | Good Fulton & Farrell | 2,928,000 |
| 68 | JRS Architect | 2,850,000 |
| 69 | HNTB Corp. | 2,793,299 |
| 70 | Ratio Architects | 2,720,819 |
| 71 | Inventure Design Group | 2,711,701 |
| 72 | ai Design Group | 2,663,516 |
| 73 | KZF Design | 2,544,819 |
| 74 | EwingCole | 2,510,000 |
| 75 | RS&H | 2,450,000 |
| 76 | Integrus Architecture | 2,410,899 |
| 77 | MulvannyG2 Architecture | 2,200,000 |
| 78 | Wilson Architects | 2,200,000 |
| 79 | Rosser International | 1,921,665 |
| 80 | Hoffmann Architects | 1,602,000 |
| 81 | Beyer Blinder Belle | 1,496,952 |
| 82 | LaBella Associates | 1,493,586 |
| 83 | Hnedak Bobo Group | 1,339,000 |
| 84 | Commonwealth Architects | 1,212,741 |
| 85 | Hord Coplan Macht | 1,113,153 |
| 86 | MBH Architects | 1,090,000 |
| 87 | PGAL | 1,074,700 |
| 88 | Nadel | 1,000,000 |
| 88 | Polytech Associates | 1,000,000 |
| 90 | P+R Architects | 982,666 |
| 91 | Parkhill, Smith & Cooper | 945,000 |
| 92 | Bergmann Associates | 939,420 |
| 93 | Niles Bolton Associates | 840,919 |
| 94 | Moseley Architects | 744,501 |
| 95 | Moody Nolan | 722,616 |
| 96 | H+L Architecture | 711,172 |
| 97 | EDI International | 630,916 |
| 98 | BLTa | 630,000 |
| 99 | H3 Hardy Collaboration Architecture | 611,898 |
| 100 | Hoefer Wysocki Architecture | 605,000 |
| 101 | WATG | Wimberly Interiors | 568,000 |
| 102 | Cambridge Seven Associates | 460,000 |
| 103 | Morris Architects | 335,000 |
| 104 | Emersion Design | 332,073 |
| 105 | DLA Architects | 317,730 |
| 106 | BLDD Architects | 280,000 |
| 107 | Hastings+Chivetta Architects | 243,171 |
| 108 | DesignGroup | 242,580 |
| 109 | Sherlock, Smith & Adams | 235,000 |
| 110 | Slaterpaull Architects | 230,000 |
| 111 | FitzGerald Associates Architects | 210,500 |
| 112 | Poskanzer Skott | 200,000 |
| 113 | SchenkelShultz Architecture | 197,000 |
| 114 | PHX Architecture | 180,000 |
| 115 | FGM Architects | 179,784 |
| 116 | BSA LifeStructures | 174,437 |
Top Office Sector Engineering Firms
| Rank | Company | 2013 Office Revenue |
| 1 | AECOM Technology Corp. | $964,240,000 |
| 2 | Jacobs | 504,890,000 |
| 3 | Parsons Brinckerhoff | 158,130,489 |
| 4 | Burns & McDonnell | 102,620,000 |
| 5 | Thornton Tomasetti | 63,427,107 |
| 6 | URS Corp. | 49,783,891 |
| 7 | WSP Group | 49,230,000 |
| 8 | Arup | 43,201,720 |
| 9 | H&A Architects & Engineers | 36,000,000 |
| 10 | Leidos | 28,150,000 |
| 11 | AKF Group | 27,835,000 |
| 12 | KPFF Consulting Engineers | 27,000,000 |
| 13 | Syska Hennessy Group | 26,817,533 |
| 14 | Magnusson Klemencic Associates | 16,437,499 |
| 15 | Wiss, Janney, Elstner Associates | 14,220,000 |
| 16 | Glumac | 14,102,479 |
| 17 | Dewberry | 13,478,149 |
| 18 | Bala Consulting Engineers | 12,507,000 |
| 19 | Environmental Systems Design | 12,505,965 |
| 20 | RDK Engineers | 10,690,000 |
| 21 | Vanderweil Engineers | 10,533,700 |
| 22 | GHT Limited | 9,665,000 |
| 23 | Simpson Gumpertz & Heger | 7,430,000 |
| 24 | Allen & Shariff | 7,200,000 |
| 25 | KCI Technologies | 6,400,000 |
| 26 | Walter P Moore and Associates | 6,002,650 |
| 27 | Highland Associates | 6,000,000 |
| 28 | STV | 5,339,000 |
| 29 | DeSimone Consulting Engineers | 5,084,661 |
| 30 | Aon Fire Protection Engineering Corp. | 5,000,000 |
| 31 | Hixson Architecture, Engineering, Interiors | 5,000,000 |
| 32 | SSOE Group | 4,656,959 |
| 33 | H.F. Lenz | 4,362,698 |
| 34 | Joseph R. Loring & Associates | 4,000,000 |
| 35 | KLH Engineers | 3,875,841 |
| 36 | M-E Engineers | 3,863,000 |
| 37 | Newcomb & Boyd | 3,802,993 |
| 38 | Sparling | 3,799,152 |
| 39 | Bridgers & Paxton Consulting Engineers | 3,612,041 |
| 40 | Smith Seckman Reid | 3,508,905 |
| 41 | Affiliated Engineers | 3,104,000 |
| 42 | Interface Engineering | 2,946,713 |
| 43 | Martin/Martin | 2,793,639 |
| 44 | KJWW Engineering Consultants | 2,711,604 |
| 45 | I. C. Thomasson Associates | 2,600,000 |
| 46 | TLC Engineering for Architecture | 2,329,558 |
| 47 | Henderson Engineers | 2,269,347 |
| 48 | ThermalTech Engineering | 2,250,000 |
| 49 | Heapy Engineering | 2,145,190 |
| 50 | CJL Engineering | 1,878,330 |
| 51 | Dunham Associates | 1,750,000 |
| 52 | Wick Fisher White | 1,734,113 |
| 53 | Karpinski Engineering | 1,695,420 |
| 54 | Shive-Hattery | 1,581,161 |
| 55 | CTLGroup | 1,560,000 |
| 56 | Graef | 1,469,354 |
| 57 | Paulus, Sokolowski and Sartor | 1,400,000 |
| 58 | OLA Consulting Engineers | 1,398,000 |
| 59 | TTG | 1,383,325 |
| 60 | Kamm Consulting | 1,344,151 |
| 61 | CCRD Partners | 1,270,000 |
| 62 | G&W Engineering Corp. | 1,091,000 |
| 63 | M/E Engineering | 1,034,842 |
| 64 | Brinjac Engineering | 1,032,104 |
| 65 | Coffman Engineers | 1,028,004 |
| 66 | Mazzetti | 1,013,140 |
| 67 | Rist-Frost-Shumway Engineering | 1,000,000 |
| 68 | Guernsey | 958,526 |
| 69 | Ross & Baruzzini | 828,783 |
| 70 | Apogee Consulting Group | 815,250 |
| 71 | GRW | 562,957 |
| 72 | CRB | 495,240 |
| 73 | Zak Companies | 458,187 |
| 74 | Davis, Bowen & Friedel | 331,004 |
| 75 | Wallace Engineering | 310,000 |
| 76 | French & Parrello Associates | 264,900 |
| 77 | Primera Engineers | 253,000 |
| 78 | RMF Engineering | 150,000 |
| 79 | Integrated Design Group | 137,118 |
| 80 | P2S Engineering | 135,228 |
| 81 | Spectrum Engineers | 85,926 |
| 82 | Stanley Consultants | 12,178 |
| 83 | Total Building Commissioning | 4,798 |
Top Office Sector Construction Firms
| Rank | Company | 2013 Office Revenue |
| 1 | Turner Construction | $1,965,630,000 |
| 2 | Structure Tone | 1,770,996,000 |
| 3 | Balfour Beatty US | 1,083,107,816 |
| 4 | PCL Construction | 965,124,704 |
| 5 | Gilbane | 850,668,144 |
| 6 | Clark Group | 768,213,069 |
| 7 | Skanska USA | 756,888,741 |
| 8 | Hensel Phelps | 595,480,000 |
| 9 | Suffolk Construction | 575,149,178 |
| 10 | HITT Contracting | 510,600,000 |
| 11 | Whiting-Turner Contracting Co., The | 483,040,306 |
| 12 | Hathaway Dinwiddie Construction | 478,000,000 |
| 13 | Clayco | 474,300,000 |
| 14 | DPR Construction | 419,864,261 |
| 15 | James G. Davis Construction | 409,209,373 |
| 16 | Holder Construction | 375,561,000 |
| 17 | Clune Construction | 350,356,681 |
| 18 | Walsh Group, The | 330,591,769 |
| 19 | JE Dunn Construction | 319,712,834 |
| 20 | Tutor Perini Corp. | 299,785,799 |
| 21 | Plaza Construction | 281,000,000 |
| 22 | Brasfield & Gorrie | 255,289,660 |
| 23 | Lend Lease | 203,243,000 |
| 24 | Ryan Companies US | 198,980,348 |
| 25 | Manhattan Construction | 195,656,000 |
| 26 | Choate Construction | 176,908,443 |
| 27 | Parsons Brinckerhoff | 158,130,489 |
| 28 | McGough | 144,000,000 |
| 29 | Austin Commercial | 126,751,064 |
| 30 | Swinerton Builders | 125,070,000 |
| 31 | McShane Companies, The | 120,701,443 |
| 32 | Pepper Construction | 116,840,000 |
| 33 | Mortenson Construction | 114,140,000 |
| 34 | JLL | 107,497,010 |
| 35 | Linbeck Group | 105,400,000 |
| 36 | C.W. Driver | 102,470,000 |
| 37 | Shawmut Design and Construction | 93,000,000 |
| 38 | B. L. Harbert International | 92,475,153 |
| 39 | CORE Construction Group | 91,118,620 |
| 40 | Leopardo Companies | 90,583,950 |
| 41 | McCarthy Holdings | 84,700,000 |
| 42 | Consigli Construction | 82,688,033 |
| 43 | Messer Construction | 75,756,377 |
| 44 | Power Construction | 67,000,000 |
| 45 | Hoar Construction | 66,258,000 |
| 46 | Weitz Company, The | 65,679,309 |
| 47 | Robins & Morton | 64,633,817 |
| 48 | Sundt Construction | 63,414,544 |
| 49 | Beck Group, The | 61,444,072 |
| 50 | Hill International | 61,000,000 |
| 51 | Yates Companies, The | 50,000,000 |
| 52 | URS Corp. | 49,783,891 |
| 53 | Hunt Construction Group | 46,000,000 |
| 54 | Fortis Construction | 41,800,000 |
| 55 | Adolfson & Peterson Construction | 40,492,626 |
| 56 | LeChase Construction Services | 39,360,000 |
| 57 | Bomel Construction | 38,747,785 |
| 58 | Rodgers Builders | 37,126,784 |
| 59 | Paric Corp. | 35,000,000 |
| 60 | Haselden Construction | 30,679,991 |
| 61 | IMC Construction | 30,597,000 |
| 62 | Barton Malow | 28,706,771 |
| 63 | Haskell | 28,625,841 |
| 64 | Coakley & Williams Construction | 26,086,629 |
| 65 | New South Construction | 22,590,000 |
| 66 | Flintco | 22,000,000 |
| 67 | EMJ Corp. | 21,000,000 |
| 68 | Layton Construction | 20,800,000 |
| 69 | E.W. Howell | 20,491,000 |
| 70 | O'Neil Industries/W.E. O'Neil | 20,354,165 |
| 71 | Heery International | 20,011,958 |
| 72 | Kitchell Corp. | 19,231,158 |
| 73 | Hill & Wilkinson | 19,149,000 |
| 74 | Walbridge | 18,100,000 |
| 75 | Wight & Company | 16,827,000 |
| 76 | Harkins Builders | 16,300,000 |
| 77 | James McHugh Construction | 14,829,260 |
| 78 | Hoffman Construction | 14,000,000 |
| 79 | Kraus-Anderson Construction | 10,000,000 |
| 80 | Batson-Cook | 8,329,557 |
| 81 | Gray Construction | 7,600,000 |
| 82 | Stalco Construction | 7,380,000 |
| 83 | Allen & Shariff | 7,200,000 |
| 84 | Boldt Company, The | 7,044,051 |
| 85 | Bernards | 6,700,000 |
| 86 | W. M. Jordan Company | 6,575,178 |
| 87 | Graycor | 6,456,452 |
| 88 | KBE Building Corp. | 5,964,801 |
| 89 | STV | 5,339,000 |
| 90 | Weis Builders | 5,031,000 |
| 91 | Bette Companies, The | 4,834,000 |
| 92 | Alberici Constructors | 2,961,966 |
| 93 | Absher Construction | 2,256,599 |
| 94 | S. M. Wilson & Co. | 1,607,814 |
| 95 | Douglas Company, The | 1,479,136 |
| 96 | LPCiminelli | 1,349,300 |
| 97 | Astorino | 1,334,650 |
Read BD+C's full 2014 Giants 300 Report
Related Stories

Market Data | Jan 6, 2023
Nonresidential construction spending rises in November 2022
Spending on nonresidential construction work in the U.S. was up 0.9% in November versus the previous month, and 11.8% versus the previous year, according to the U.S. Census Bureau.

Industry Research | Dec 28, 2022
Following a strong year, design and construction firms view 2023 cautiously
The economy and inflation are the biggest concerns for U.S. architecture, construction, and engineering firms in 2023, according to a recent survey of AEC professionals by the editors of Building Design+Construction.

Performing Arts Centers | Dec 23, 2022
Diller Scofidio + Renfro's renovation of Dallas theater to be ‘faithful reinterpretation’ of Frank Lloyd Wright design
Diller Scofidio + Renfro recently presented plans to restore the Kalita Humphreys Theater at the Dallas Theater Center (DTC) in Dallas. Originally designed by Frank Lloyd Wright, this theater is the only freestanding theater in Wright’s body of work.

University Buildings | Dec 22, 2022
Loyola Marymount University completes a new home for its acclaimed School of Film and Television
California’s Loyola Marymount University (LMU) has completed two new buildings for arts and media education at its Westchester campus. Designed by Skidmore, Owings & Merrill (SOM), the Howard B. Fitzpatrick Pavilion is the new home of the undergraduate School of Film and Television, which is consistently ranked among the nation’s top 10 film schools. Also designed by SOM, the open-air Drollinger Family Stage is an outdoor lecture and performance space.

Adaptive Reuse | Dec 21, 2022
University of Pittsburgh reinvents century-old Model-T building as a life sciences research facility
After opening earlier this year, The Assembly recently achieved LEED Gold certification, aligning with the school’s and community’s larger sustainability efforts.

Multifamily Housing | Dec 20, 2022
Brooks + Scarpa-designed apartment provides affordable housing to young people aging out of support facilities
In Venice, Calif., the recently completed Rose Apartments provides affordable housing to young people who age out of youth facilities and often end up living on the street. Designed by Brooks + Scarpa, the four-story, 35-unit mixed-use apartment building will house transitional aged youths.

Coatings | Dec 20, 2022
The Pier Condominiums — What's old is new again!
When word was out that the condominium association was planning to carry out a refresh of the Pier Condominiums on Fort Norfolk, Hanbury jumped at the chance to remake what had become a tired, faded project.
Cladding and Facade Systems | Dec 20, 2022
Acoustic design considerations at the building envelope
Acentech's Ben Markham identifies the primary concerns with acoustic performance at the building envelope and offers proven solutions for mitigating acoustic issues.
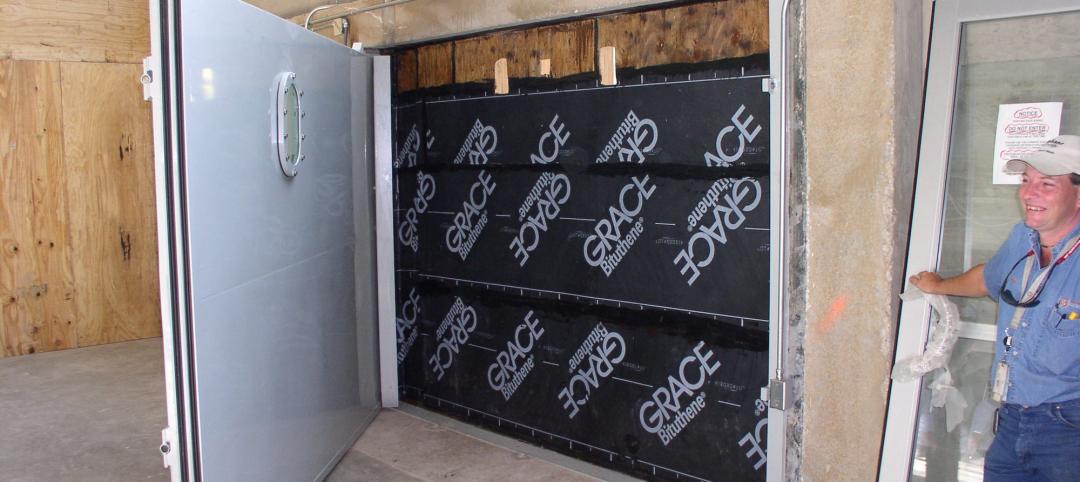
Sponsored | Resiliency | Dec 14, 2022
Flood protection: What building owners need to know to protect their properties
This course from Walter P Moore examines numerous flood protection approaches and building owner needs before delving into the flood protection process. Determining the flood resilience of a property can provide a good understanding of risk associated costs.

Architects | Dec 14, 2022
Carol Ross Barney, FAIA, named 2023 AIA Gold Medal honoree
The Board of Directors and the Strategic Council of the American Institute of Architects (AIA) are honoring Carol Ross Barney, FAIA, with the 2023 Gold Medal. The Gold Medal honors an individual whose significant body of work has had a lasting influence on the theory and practice of architecture.


