


The office market continues to improve, with many projects in development. Rents are rising as vacancy decreases, according to Jones Lang LaSalle’s 2014 U.S. Office Outlook (http://bit.ly/1ildrS7). Dozens of markets are classified as experiencing a “rising phase” (among them, Phoenix, Chicago, Salt Lake City, and Atlanta), while Dallas, Houston, San Francisco, and the Silicon Valley are believed to be peaking.
New-construction leaders include Houston and New York City, and even in calmer markets, AEC firms are busy with workplace fitouts and renovations.
The adage “doing more with less” has become a byword for many businesses since the Great Recession, and clients are trying to maximize every precious inch. “Everyone is looking to use less space,” says Daniel P. Perruzzi, Jr., AIA, LEED AP, Principal at Boston-based Margulies Perruzzi Architects. “They’re looking at ways to modify their office and workplace standards so that they can fit into less.”
Hierarchical office assignments are becoming passé, as is the notion that people will stay in their cubicles for much of the day. “A lot of companies are going down to a single size for offices, so they’re not awarding that space on the basis of rank,” notes Perruzzi. “And as a rule, companies are looking to change the ratio between offices and open workstations. It’s all driven by collaboration.”
Non-assigned space concepts continue to gain popularity. Whether or not they’re actual telecommuters, workers on the move require well-considered accommodations, including easily accessible plug-ins for laptops, tablets, and smartphones. Says Perruzzi, “You have to think about the accommodations both technically and physically. Workers want to be able to plug in their devices and see their desktop no matter which workstation they’re using.”
Analyses by experts like CoreNet Global indicate that space per worker may drop below 100 sf within five years. Perruzzi says workstations won’t necessarily keep shrinking but will likely keep reducing in number. Margulies Perruzzi’s design for Philips North America’s first Workplace Innovation Center involved no private offices and 200 physical workstations for about 260 employees. Called “free addressing,” the plan allows employees to migrate from desk to desk while reducing the number of empty spots left by workers who are off-site.
Says Perruzzi: “There’s no such thing as an individual contributor anymore. It’s about people working in teams that change on a regular basis, are very dynamic, and need constant access to each other.”
Top Office Sector Architecture Firms
| Rank | Company | 2013 Office Revenue |
| 1 | Gensler | $472,552,752 |
| 2 | HOK | 141,723,793 |
| 3 | Perkins+will | 112,815,842 |
| 4 | Skidmore, Owings & Merrill | 83,599,900 |
| 5 | NBBJ | 64,107,000 |
| 6 | Stantec | 62,594,213 |
| 7 | ZGF Architects | 43,902,072 |
| 8 | Page | 37,460,000 |
| 9 | Kohn Pedersen Fox Associates | 36,176,000 |
| 10 | Nelson | 36,089,550 |
| 11 | SmithGroupJJR | 35,614,366 |
| 12 | Hammel, Green and Abrahamson | 33,267,365 |
| 13 | RTKL Associates | 30,705,000 |
| 14 | EYP Architecture & Engineering | 30,000,000 |
| 15 | CannonDesign | 29,000,000 |
| 16 | HKS | 26,255,885 |
| 17 | Corgan | 24,977,990 |
| 18 | HDR | 24,700,000 |
| 19 | RSP Architects | 23,106,000 |
| 20 | Leo A Daly | 20,101,466 |
| 21 | Heery International | 20,011,958 |
| 22 | LS3P | 17,522,964 |
| 23 | Ware Malcomb | 17,500,000 |
| 24 | Kirksey | 15,989,864 |
| 25 | LPA | 15,875,503 |
| 26 | Perkins Eastman | 15,000,000 |
| 27 | NORR | 14,244,421 |
| 28 | Goettsch Partners | 12,070,000 |
| 29 | VOA Associates | 11,040,757 |
| 30 | Epstein | 10,752,000 |
| 31 | CTA Architects Engineers | 10,438,159 |
| 32 | Margulies Perruzzi Architects | 10,191,746 |
| 33 | Cuningham Group Architecture | 10,068,814 |
| 34 | BRPH | 9,906,000 |
| 35 | DLR Group | 9,800,000 |
| 36 | Environetics | 9,612,351 |
| 37 | Vocon | 9,203,152 |
| 38 | RNL | 8,941,000 |
| 39 | Gresham, Smith and Partners | 8,768,000 |
| 40 | Ziegler Cooper | 8,676,816 |
| 41 | Davis Brody Bond | 8,369,474 |
| 42 | FXFOWLE Architects | 7,880,000 |
| 43 | Adrian Smith + Gordon Gill Architecture | 7,750,000 |
| 44 | Clark Nexsen | 7,707,493 |
| 45 | LMN Architects | 7,368,900 |
| 46 | Little | 7,253,565 |
| 47 | Cooper Carry | 7,227,738 |
| 48 | Symmes Maini & McKee Associates | 6,490,000 |
| 49 | WDG Architecture | 5,844,000 |
| 50 | Solomon Cordwell Buenz | 5,300,000 |
| 51 | Carrier Johnson + Culture | 5,118,818 |
| 52 | Swanke Hayden Connell Architects | 4,990,000 |
| 53 | Eppstein Uhen Architects | 4,972,955 |
| 54 | Fentress Architects | 4,551,790 |
| 55 | Francis Cauffman | 4,187,463 |
| 56 | Wight & Company | 3,683,000 |
| 57 | Smallwood, Reynolds, Stewart, Stewart & Associates | 3,653,284 |
| 58 | OZ Architecture | 3,625,600 |
| 59 | GBBN Architects | 3,540,500 |
| 60 | Callison | 3,481,227 |
| 61 | HMC Architects | 3,388,658 |
| 62 | Albert Kahn Associates | 3,297,848 |
| 63 | Baskervill | 3,226,678 |
| 64 | Rule Joy Trammell + Rubio | 3,120,000 |
| 65 | Montroy Andersen DeMarco | 3,107,000 |
| 66 | Goodwyn Mills & Cawood | 2,932,849 |
| 67 | Good Fulton & Farrell | 2,928,000 |
| 68 | JRS Architect | 2,850,000 |
| 69 | HNTB Corp. | 2,793,299 |
| 70 | Ratio Architects | 2,720,819 |
| 71 | Inventure Design Group | 2,711,701 |
| 72 | ai Design Group | 2,663,516 |
| 73 | KZF Design | 2,544,819 |
| 74 | EwingCole | 2,510,000 |
| 75 | RS&H | 2,450,000 |
| 76 | Integrus Architecture | 2,410,899 |
| 77 | MulvannyG2 Architecture | 2,200,000 |
| 78 | Wilson Architects | 2,200,000 |
| 79 | Rosser International | 1,921,665 |
| 80 | Hoffmann Architects | 1,602,000 |
| 81 | Beyer Blinder Belle | 1,496,952 |
| 82 | LaBella Associates | 1,493,586 |
| 83 | Hnedak Bobo Group | 1,339,000 |
| 84 | Commonwealth Architects | 1,212,741 |
| 85 | Hord Coplan Macht | 1,113,153 |
| 86 | MBH Architects | 1,090,000 |
| 87 | PGAL | 1,074,700 |
| 88 | Nadel | 1,000,000 |
| 88 | Polytech Associates | 1,000,000 |
| 90 | P+R Architects | 982,666 |
| 91 | Parkhill, Smith & Cooper | 945,000 |
| 92 | Bergmann Associates | 939,420 |
| 93 | Niles Bolton Associates | 840,919 |
| 94 | Moseley Architects | 744,501 |
| 95 | Moody Nolan | 722,616 |
| 96 | H+L Architecture | 711,172 |
| 97 | EDI International | 630,916 |
| 98 | BLTa | 630,000 |
| 99 | H3 Hardy Collaboration Architecture | 611,898 |
| 100 | Hoefer Wysocki Architecture | 605,000 |
| 101 | WATG | Wimberly Interiors | 568,000 |
| 102 | Cambridge Seven Associates | 460,000 |
| 103 | Morris Architects | 335,000 |
| 104 | Emersion Design | 332,073 |
| 105 | DLA Architects | 317,730 |
| 106 | BLDD Architects | 280,000 |
| 107 | Hastings+Chivetta Architects | 243,171 |
| 108 | DesignGroup | 242,580 |
| 109 | Sherlock, Smith & Adams | 235,000 |
| 110 | Slaterpaull Architects | 230,000 |
| 111 | FitzGerald Associates Architects | 210,500 |
| 112 | Poskanzer Skott | 200,000 |
| 113 | SchenkelShultz Architecture | 197,000 |
| 114 | PHX Architecture | 180,000 |
| 115 | FGM Architects | 179,784 |
| 116 | BSA LifeStructures | 174,437 |
Top Office Sector Engineering Firms
| Rank | Company | 2013 Office Revenue |
| 1 | AECOM Technology Corp. | $964,240,000 |
| 2 | Jacobs | 504,890,000 |
| 3 | Parsons Brinckerhoff | 158,130,489 |
| 4 | Burns & McDonnell | 102,620,000 |
| 5 | Thornton Tomasetti | 63,427,107 |
| 6 | URS Corp. | 49,783,891 |
| 7 | WSP Group | 49,230,000 |
| 8 | Arup | 43,201,720 |
| 9 | H&A Architects & Engineers | 36,000,000 |
| 10 | Leidos | 28,150,000 |
| 11 | AKF Group | 27,835,000 |
| 12 | KPFF Consulting Engineers | 27,000,000 |
| 13 | Syska Hennessy Group | 26,817,533 |
| 14 | Magnusson Klemencic Associates | 16,437,499 |
| 15 | Wiss, Janney, Elstner Associates | 14,220,000 |
| 16 | Glumac | 14,102,479 |
| 17 | Dewberry | 13,478,149 |
| 18 | Bala Consulting Engineers | 12,507,000 |
| 19 | Environmental Systems Design | 12,505,965 |
| 20 | RDK Engineers | 10,690,000 |
| 21 | Vanderweil Engineers | 10,533,700 |
| 22 | GHT Limited | 9,665,000 |
| 23 | Simpson Gumpertz & Heger | 7,430,000 |
| 24 | Allen & Shariff | 7,200,000 |
| 25 | KCI Technologies | 6,400,000 |
| 26 | Walter P Moore and Associates | 6,002,650 |
| 27 | Highland Associates | 6,000,000 |
| 28 | STV | 5,339,000 |
| 29 | DeSimone Consulting Engineers | 5,084,661 |
| 30 | Aon Fire Protection Engineering Corp. | 5,000,000 |
| 31 | Hixson Architecture, Engineering, Interiors | 5,000,000 |
| 32 | SSOE Group | 4,656,959 |
| 33 | H.F. Lenz | 4,362,698 |
| 34 | Joseph R. Loring & Associates | 4,000,000 |
| 35 | KLH Engineers | 3,875,841 |
| 36 | M-E Engineers | 3,863,000 |
| 37 | Newcomb & Boyd | 3,802,993 |
| 38 | Sparling | 3,799,152 |
| 39 | Bridgers & Paxton Consulting Engineers | 3,612,041 |
| 40 | Smith Seckman Reid | 3,508,905 |
| 41 | Affiliated Engineers | 3,104,000 |
| 42 | Interface Engineering | 2,946,713 |
| 43 | Martin/Martin | 2,793,639 |
| 44 | KJWW Engineering Consultants | 2,711,604 |
| 45 | I. C. Thomasson Associates | 2,600,000 |
| 46 | TLC Engineering for Architecture | 2,329,558 |
| 47 | Henderson Engineers | 2,269,347 |
| 48 | ThermalTech Engineering | 2,250,000 |
| 49 | Heapy Engineering | 2,145,190 |
| 50 | CJL Engineering | 1,878,330 |
| 51 | Dunham Associates | 1,750,000 |
| 52 | Wick Fisher White | 1,734,113 |
| 53 | Karpinski Engineering | 1,695,420 |
| 54 | Shive-Hattery | 1,581,161 |
| 55 | CTLGroup | 1,560,000 |
| 56 | Graef | 1,469,354 |
| 57 | Paulus, Sokolowski and Sartor | 1,400,000 |
| 58 | OLA Consulting Engineers | 1,398,000 |
| 59 | TTG | 1,383,325 |
| 60 | Kamm Consulting | 1,344,151 |
| 61 | CCRD Partners | 1,270,000 |
| 62 | G&W Engineering Corp. | 1,091,000 |
| 63 | M/E Engineering | 1,034,842 |
| 64 | Brinjac Engineering | 1,032,104 |
| 65 | Coffman Engineers | 1,028,004 |
| 66 | Mazzetti | 1,013,140 |
| 67 | Rist-Frost-Shumway Engineering | 1,000,000 |
| 68 | Guernsey | 958,526 |
| 69 | Ross & Baruzzini | 828,783 |
| 70 | Apogee Consulting Group | 815,250 |
| 71 | GRW | 562,957 |
| 72 | CRB | 495,240 |
| 73 | Zak Companies | 458,187 |
| 74 | Davis, Bowen & Friedel | 331,004 |
| 75 | Wallace Engineering | 310,000 |
| 76 | French & Parrello Associates | 264,900 |
| 77 | Primera Engineers | 253,000 |
| 78 | RMF Engineering | 150,000 |
| 79 | Integrated Design Group | 137,118 |
| 80 | P2S Engineering | 135,228 |
| 81 | Spectrum Engineers | 85,926 |
| 82 | Stanley Consultants | 12,178 |
| 83 | Total Building Commissioning | 4,798 |
Top Office Sector Construction Firms
| Rank | Company | 2013 Office Revenue |
| 1 | Turner Construction | $1,965,630,000 |
| 2 | Structure Tone | 1,770,996,000 |
| 3 | Balfour Beatty US | 1,083,107,816 |
| 4 | PCL Construction | 965,124,704 |
| 5 | Gilbane | 850,668,144 |
| 6 | Clark Group | 768,213,069 |
| 7 | Skanska USA | 756,888,741 |
| 8 | Hensel Phelps | 595,480,000 |
| 9 | Suffolk Construction | 575,149,178 |
| 10 | HITT Contracting | 510,600,000 |
| 11 | Whiting-Turner Contracting Co., The | 483,040,306 |
| 12 | Hathaway Dinwiddie Construction | 478,000,000 |
| 13 | Clayco | 474,300,000 |
| 14 | DPR Construction | 419,864,261 |
| 15 | James G. Davis Construction | 409,209,373 |
| 16 | Holder Construction | 375,561,000 |
| 17 | Clune Construction | 350,356,681 |
| 18 | Walsh Group, The | 330,591,769 |
| 19 | JE Dunn Construction | 319,712,834 |
| 20 | Tutor Perini Corp. | 299,785,799 |
| 21 | Plaza Construction | 281,000,000 |
| 22 | Brasfield & Gorrie | 255,289,660 |
| 23 | Lend Lease | 203,243,000 |
| 24 | Ryan Companies US | 198,980,348 |
| 25 | Manhattan Construction | 195,656,000 |
| 26 | Choate Construction | 176,908,443 |
| 27 | Parsons Brinckerhoff | 158,130,489 |
| 28 | McGough | 144,000,000 |
| 29 | Austin Commercial | 126,751,064 |
| 30 | Swinerton Builders | 125,070,000 |
| 31 | McShane Companies, The | 120,701,443 |
| 32 | Pepper Construction | 116,840,000 |
| 33 | Mortenson Construction | 114,140,000 |
| 34 | JLL | 107,497,010 |
| 35 | Linbeck Group | 105,400,000 |
| 36 | C.W. Driver | 102,470,000 |
| 37 | Shawmut Design and Construction | 93,000,000 |
| 38 | B. L. Harbert International | 92,475,153 |
| 39 | CORE Construction Group | 91,118,620 |
| 40 | Leopardo Companies | 90,583,950 |
| 41 | McCarthy Holdings | 84,700,000 |
| 42 | Consigli Construction | 82,688,033 |
| 43 | Messer Construction | 75,756,377 |
| 44 | Power Construction | 67,000,000 |
| 45 | Hoar Construction | 66,258,000 |
| 46 | Weitz Company, The | 65,679,309 |
| 47 | Robins & Morton | 64,633,817 |
| 48 | Sundt Construction | 63,414,544 |
| 49 | Beck Group, The | 61,444,072 |
| 50 | Hill International | 61,000,000 |
| 51 | Yates Companies, The | 50,000,000 |
| 52 | URS Corp. | 49,783,891 |
| 53 | Hunt Construction Group | 46,000,000 |
| 54 | Fortis Construction | 41,800,000 |
| 55 | Adolfson & Peterson Construction | 40,492,626 |
| 56 | LeChase Construction Services | 39,360,000 |
| 57 | Bomel Construction | 38,747,785 |
| 58 | Rodgers Builders | 37,126,784 |
| 59 | Paric Corp. | 35,000,000 |
| 60 | Haselden Construction | 30,679,991 |
| 61 | IMC Construction | 30,597,000 |
| 62 | Barton Malow | 28,706,771 |
| 63 | Haskell | 28,625,841 |
| 64 | Coakley & Williams Construction | 26,086,629 |
| 65 | New South Construction | 22,590,000 |
| 66 | Flintco | 22,000,000 |
| 67 | EMJ Corp. | 21,000,000 |
| 68 | Layton Construction | 20,800,000 |
| 69 | E.W. Howell | 20,491,000 |
| 70 | O'Neil Industries/W.E. O'Neil | 20,354,165 |
| 71 | Heery International | 20,011,958 |
| 72 | Kitchell Corp. | 19,231,158 |
| 73 | Hill & Wilkinson | 19,149,000 |
| 74 | Walbridge | 18,100,000 |
| 75 | Wight & Company | 16,827,000 |
| 76 | Harkins Builders | 16,300,000 |
| 77 | James McHugh Construction | 14,829,260 |
| 78 | Hoffman Construction | 14,000,000 |
| 79 | Kraus-Anderson Construction | 10,000,000 |
| 80 | Batson-Cook | 8,329,557 |
| 81 | Gray Construction | 7,600,000 |
| 82 | Stalco Construction | 7,380,000 |
| 83 | Allen & Shariff | 7,200,000 |
| 84 | Boldt Company, The | 7,044,051 |
| 85 | Bernards | 6,700,000 |
| 86 | W. M. Jordan Company | 6,575,178 |
| 87 | Graycor | 6,456,452 |
| 88 | KBE Building Corp. | 5,964,801 |
| 89 | STV | 5,339,000 |
| 90 | Weis Builders | 5,031,000 |
| 91 | Bette Companies, The | 4,834,000 |
| 92 | Alberici Constructors | 2,961,966 |
| 93 | Absher Construction | 2,256,599 |
| 94 | S. M. Wilson & Co. | 1,607,814 |
| 95 | Douglas Company, The | 1,479,136 |
| 96 | LPCiminelli | 1,349,300 |
| 97 | Astorino | 1,334,650 |
Read BD+C's full 2014 Giants 300 Report
Related Stories
| Jan 21, 2011
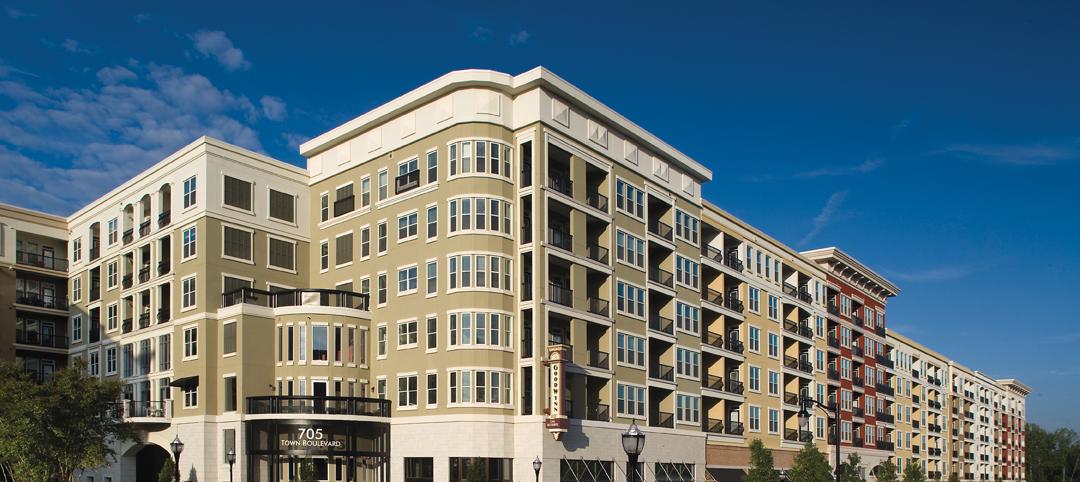
Upscale apartments offer residents a twist on modern history
The Goodwynn at Town: Brookhaven, a 433,300-sf residential and retail building in DeKalb County, Ga., combines a historic look with modern amenities. Atlanta-based project architect Niles Bolton Associates used contemporary materials in historic patterns and colors on the exterior, while concealing a six-level parking structure on the interior.

| Jan 21, 2011
Research center built for interdisciplinary cooperation
The Jan and Dan Duncan Neurological Research Institute at Texas Children’s Hospital, in Houston, the first basic research institute for childhood neurological diseases, is a 13-story twisting tower in the center of the hospital campus.
| Jan 21, 2011
Music festival’s new home showcases scenic setting
Epstein Joslin Architects, Cambridge, Mass., designed the Shalin Liu Performance Center in Rockport, Mass., to showcase the Rockport Chamber Music Festival, as well at the site’s ocean views.
| Jan 21, 2011
GSA Recognizes the Best in Public Architecture
The U.S. General Services Administration recognized the best in public architecture and civilian federal workplaces at the 2010 GSA Design Awards in Washington, D.C. This year's 11 award winners showcase the federal government's commitment to cutting-edge architectural design and its focus on sustainability.

| Jan 20, 2011
Houston Dynamo soccer team plans new venue
Construction is scheduled to begin this month on a new 22,000-seat Major League Soccer stadium for the Houston Dynamo. The $60 million project is expected to be ready for the 2012 MLS season.
| Jan 20, 2011
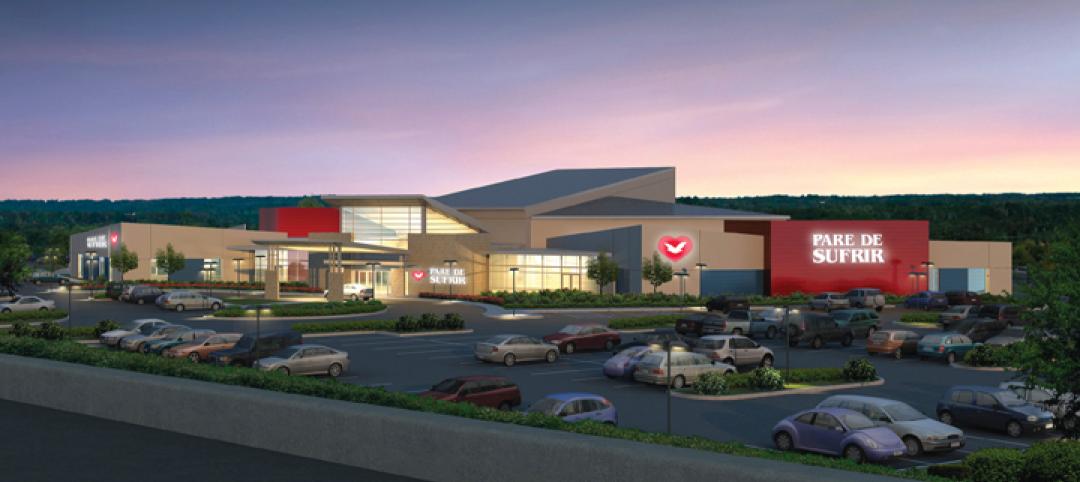
Worship center design offers warm and welcoming atmosphere
The Worship Place Studio of local firm Ziegler Cooper Architects designed a new 46,000-sf church complex for the Pare de Sufrir parish in Houston.

| Jan 20, 2011
Construction begins on second St. Louis community center
O’Fallon Park Recreation Complex in St. Louis, designed by local architecture/engineering firm KAI Design & Build, will feature an indoor aquatic park with interactive water play features, a lazy river, water slides, laps lanes, and an outdoor spray and multiuse pool.

| Jan 20, 2011
Community college to prepare next-gen Homeland Security personnel
The College of DuPage, Glen Ellyn, Ill., began work on the Homeland Security Education Center, which will prepare future emergency personnel to tackle terrorist attacks and disasters. The $25 million, 61,100-sf building’s centerpiece will be an immersive interior street lab for urban response simulations.

| Jan 19, 2011
Industrial history museum gets new home in steel plant
The National Museum of Industrial History recently renovated the exterior of a 1913 steel plant in Bethlehem, Pa., to house its new 40,000-sf exhibition space. The museum chose VOA Associates, which is headquartered in Chicago, to complete the design for the exhibit’s interior. The exhibit, which has views of five historic blast furnaces, will feature artifacts from the Smithsonian Institution to illustrate early industrial America.
| Jan 19, 2011
Baltimore mixed-use development combines working, living, and shopping
The Shoppes at McHenry Row, a $117 million mixed-use complex developed by 28 Walker Associates for downtown Baltimore, will include 65,000 sf of office space, 250 apartments, and two parking garages. The 48,000 sf of main street retail space currently is 65% occupied, with space for small shops and a restaurant remaining.


