


The office market continues to improve, with many projects in development. Rents are rising as vacancy decreases, according to Jones Lang LaSalle’s 2014 U.S. Office Outlook (http://bit.ly/1ildrS7). Dozens of markets are classified as experiencing a “rising phase” (among them, Phoenix, Chicago, Salt Lake City, and Atlanta), while Dallas, Houston, San Francisco, and the Silicon Valley are believed to be peaking.
New-construction leaders include Houston and New York City, and even in calmer markets, AEC firms are busy with workplace fitouts and renovations.
The adage “doing more with less” has become a byword for many businesses since the Great Recession, and clients are trying to maximize every precious inch. “Everyone is looking to use less space,” says Daniel P. Perruzzi, Jr., AIA, LEED AP, Principal at Boston-based Margulies Perruzzi Architects. “They’re looking at ways to modify their office and workplace standards so that they can fit into less.”
Hierarchical office assignments are becoming passé, as is the notion that people will stay in their cubicles for much of the day. “A lot of companies are going down to a single size for offices, so they’re not awarding that space on the basis of rank,” notes Perruzzi. “And as a rule, companies are looking to change the ratio between offices and open workstations. It’s all driven by collaboration.”
Non-assigned space concepts continue to gain popularity. Whether or not they’re actual telecommuters, workers on the move require well-considered accommodations, including easily accessible plug-ins for laptops, tablets, and smartphones. Says Perruzzi, “You have to think about the accommodations both technically and physically. Workers want to be able to plug in their devices and see their desktop no matter which workstation they’re using.”
Analyses by experts like CoreNet Global indicate that space per worker may drop below 100 sf within five years. Perruzzi says workstations won’t necessarily keep shrinking but will likely keep reducing in number. Margulies Perruzzi’s design for Philips North America’s first Workplace Innovation Center involved no private offices and 200 physical workstations for about 260 employees. Called “free addressing,” the plan allows employees to migrate from desk to desk while reducing the number of empty spots left by workers who are off-site.
Says Perruzzi: “There’s no such thing as an individual contributor anymore. It’s about people working in teams that change on a regular basis, are very dynamic, and need constant access to each other.”
Top Office Sector Architecture Firms
| Rank | Company | 2013 Office Revenue |
| 1 | Gensler | $472,552,752 |
| 2 | HOK | 141,723,793 |
| 3 | Perkins+will | 112,815,842 |
| 4 | Skidmore, Owings & Merrill | 83,599,900 |
| 5 | NBBJ | 64,107,000 |
| 6 | Stantec | 62,594,213 |
| 7 | ZGF Architects | 43,902,072 |
| 8 | Page | 37,460,000 |
| 9 | Kohn Pedersen Fox Associates | 36,176,000 |
| 10 | Nelson | 36,089,550 |
| 11 | SmithGroupJJR | 35,614,366 |
| 12 | Hammel, Green and Abrahamson | 33,267,365 |
| 13 | RTKL Associates | 30,705,000 |
| 14 | EYP Architecture & Engineering | 30,000,000 |
| 15 | CannonDesign | 29,000,000 |
| 16 | HKS | 26,255,885 |
| 17 | Corgan | 24,977,990 |
| 18 | HDR | 24,700,000 |
| 19 | RSP Architects | 23,106,000 |
| 20 | Leo A Daly | 20,101,466 |
| 21 | Heery International | 20,011,958 |
| 22 | LS3P | 17,522,964 |
| 23 | Ware Malcomb | 17,500,000 |
| 24 | Kirksey | 15,989,864 |
| 25 | LPA | 15,875,503 |
| 26 | Perkins Eastman | 15,000,000 |
| 27 | NORR | 14,244,421 |
| 28 | Goettsch Partners | 12,070,000 |
| 29 | VOA Associates | 11,040,757 |
| 30 | Epstein | 10,752,000 |
| 31 | CTA Architects Engineers | 10,438,159 |
| 32 | Margulies Perruzzi Architects | 10,191,746 |
| 33 | Cuningham Group Architecture | 10,068,814 |
| 34 | BRPH | 9,906,000 |
| 35 | DLR Group | 9,800,000 |
| 36 | Environetics | 9,612,351 |
| 37 | Vocon | 9,203,152 |
| 38 | RNL | 8,941,000 |
| 39 | Gresham, Smith and Partners | 8,768,000 |
| 40 | Ziegler Cooper | 8,676,816 |
| 41 | Davis Brody Bond | 8,369,474 |
| 42 | FXFOWLE Architects | 7,880,000 |
| 43 | Adrian Smith + Gordon Gill Architecture | 7,750,000 |
| 44 | Clark Nexsen | 7,707,493 |
| 45 | LMN Architects | 7,368,900 |
| 46 | Little | 7,253,565 |
| 47 | Cooper Carry | 7,227,738 |
| 48 | Symmes Maini & McKee Associates | 6,490,000 |
| 49 | WDG Architecture | 5,844,000 |
| 50 | Solomon Cordwell Buenz | 5,300,000 |
| 51 | Carrier Johnson + Culture | 5,118,818 |
| 52 | Swanke Hayden Connell Architects | 4,990,000 |
| 53 | Eppstein Uhen Architects | 4,972,955 |
| 54 | Fentress Architects | 4,551,790 |
| 55 | Francis Cauffman | 4,187,463 |
| 56 | Wight & Company | 3,683,000 |
| 57 | Smallwood, Reynolds, Stewart, Stewart & Associates | 3,653,284 |
| 58 | OZ Architecture | 3,625,600 |
| 59 | GBBN Architects | 3,540,500 |
| 60 | Callison | 3,481,227 |
| 61 | HMC Architects | 3,388,658 |
| 62 | Albert Kahn Associates | 3,297,848 |
| 63 | Baskervill | 3,226,678 |
| 64 | Rule Joy Trammell + Rubio | 3,120,000 |
| 65 | Montroy Andersen DeMarco | 3,107,000 |
| 66 | Goodwyn Mills & Cawood | 2,932,849 |
| 67 | Good Fulton & Farrell | 2,928,000 |
| 68 | JRS Architect | 2,850,000 |
| 69 | HNTB Corp. | 2,793,299 |
| 70 | Ratio Architects | 2,720,819 |
| 71 | Inventure Design Group | 2,711,701 |
| 72 | ai Design Group | 2,663,516 |
| 73 | KZF Design | 2,544,819 |
| 74 | EwingCole | 2,510,000 |
| 75 | RS&H | 2,450,000 |
| 76 | Integrus Architecture | 2,410,899 |
| 77 | MulvannyG2 Architecture | 2,200,000 |
| 78 | Wilson Architects | 2,200,000 |
| 79 | Rosser International | 1,921,665 |
| 80 | Hoffmann Architects | 1,602,000 |
| 81 | Beyer Blinder Belle | 1,496,952 |
| 82 | LaBella Associates | 1,493,586 |
| 83 | Hnedak Bobo Group | 1,339,000 |
| 84 | Commonwealth Architects | 1,212,741 |
| 85 | Hord Coplan Macht | 1,113,153 |
| 86 | MBH Architects | 1,090,000 |
| 87 | PGAL | 1,074,700 |
| 88 | Nadel | 1,000,000 |
| 88 | Polytech Associates | 1,000,000 |
| 90 | P+R Architects | 982,666 |
| 91 | Parkhill, Smith & Cooper | 945,000 |
| 92 | Bergmann Associates | 939,420 |
| 93 | Niles Bolton Associates | 840,919 |
| 94 | Moseley Architects | 744,501 |
| 95 | Moody Nolan | 722,616 |
| 96 | H+L Architecture | 711,172 |
| 97 | EDI International | 630,916 |
| 98 | BLTa | 630,000 |
| 99 | H3 Hardy Collaboration Architecture | 611,898 |
| 100 | Hoefer Wysocki Architecture | 605,000 |
| 101 | WATG | Wimberly Interiors | 568,000 |
| 102 | Cambridge Seven Associates | 460,000 |
| 103 | Morris Architects | 335,000 |
| 104 | Emersion Design | 332,073 |
| 105 | DLA Architects | 317,730 |
| 106 | BLDD Architects | 280,000 |
| 107 | Hastings+Chivetta Architects | 243,171 |
| 108 | DesignGroup | 242,580 |
| 109 | Sherlock, Smith & Adams | 235,000 |
| 110 | Slaterpaull Architects | 230,000 |
| 111 | FitzGerald Associates Architects | 210,500 |
| 112 | Poskanzer Skott | 200,000 |
| 113 | SchenkelShultz Architecture | 197,000 |
| 114 | PHX Architecture | 180,000 |
| 115 | FGM Architects | 179,784 |
| 116 | BSA LifeStructures | 174,437 |
Top Office Sector Engineering Firms
| Rank | Company | 2013 Office Revenue |
| 1 | AECOM Technology Corp. | $964,240,000 |
| 2 | Jacobs | 504,890,000 |
| 3 | Parsons Brinckerhoff | 158,130,489 |
| 4 | Burns & McDonnell | 102,620,000 |
| 5 | Thornton Tomasetti | 63,427,107 |
| 6 | URS Corp. | 49,783,891 |
| 7 | WSP Group | 49,230,000 |
| 8 | Arup | 43,201,720 |
| 9 | H&A Architects & Engineers | 36,000,000 |
| 10 | Leidos | 28,150,000 |
| 11 | AKF Group | 27,835,000 |
| 12 | KPFF Consulting Engineers | 27,000,000 |
| 13 | Syska Hennessy Group | 26,817,533 |
| 14 | Magnusson Klemencic Associates | 16,437,499 |
| 15 | Wiss, Janney, Elstner Associates | 14,220,000 |
| 16 | Glumac | 14,102,479 |
| 17 | Dewberry | 13,478,149 |
| 18 | Bala Consulting Engineers | 12,507,000 |
| 19 | Environmental Systems Design | 12,505,965 |
| 20 | RDK Engineers | 10,690,000 |
| 21 | Vanderweil Engineers | 10,533,700 |
| 22 | GHT Limited | 9,665,000 |
| 23 | Simpson Gumpertz & Heger | 7,430,000 |
| 24 | Allen & Shariff | 7,200,000 |
| 25 | KCI Technologies | 6,400,000 |
| 26 | Walter P Moore and Associates | 6,002,650 |
| 27 | Highland Associates | 6,000,000 |
| 28 | STV | 5,339,000 |
| 29 | DeSimone Consulting Engineers | 5,084,661 |
| 30 | Aon Fire Protection Engineering Corp. | 5,000,000 |
| 31 | Hixson Architecture, Engineering, Interiors | 5,000,000 |
| 32 | SSOE Group | 4,656,959 |
| 33 | H.F. Lenz | 4,362,698 |
| 34 | Joseph R. Loring & Associates | 4,000,000 |
| 35 | KLH Engineers | 3,875,841 |
| 36 | M-E Engineers | 3,863,000 |
| 37 | Newcomb & Boyd | 3,802,993 |
| 38 | Sparling | 3,799,152 |
| 39 | Bridgers & Paxton Consulting Engineers | 3,612,041 |
| 40 | Smith Seckman Reid | 3,508,905 |
| 41 | Affiliated Engineers | 3,104,000 |
| 42 | Interface Engineering | 2,946,713 |
| 43 | Martin/Martin | 2,793,639 |
| 44 | KJWW Engineering Consultants | 2,711,604 |
| 45 | I. C. Thomasson Associates | 2,600,000 |
| 46 | TLC Engineering for Architecture | 2,329,558 |
| 47 | Henderson Engineers | 2,269,347 |
| 48 | ThermalTech Engineering | 2,250,000 |
| 49 | Heapy Engineering | 2,145,190 |
| 50 | CJL Engineering | 1,878,330 |
| 51 | Dunham Associates | 1,750,000 |
| 52 | Wick Fisher White | 1,734,113 |
| 53 | Karpinski Engineering | 1,695,420 |
| 54 | Shive-Hattery | 1,581,161 |
| 55 | CTLGroup | 1,560,000 |
| 56 | Graef | 1,469,354 |
| 57 | Paulus, Sokolowski and Sartor | 1,400,000 |
| 58 | OLA Consulting Engineers | 1,398,000 |
| 59 | TTG | 1,383,325 |
| 60 | Kamm Consulting | 1,344,151 |
| 61 | CCRD Partners | 1,270,000 |
| 62 | G&W Engineering Corp. | 1,091,000 |
| 63 | M/E Engineering | 1,034,842 |
| 64 | Brinjac Engineering | 1,032,104 |
| 65 | Coffman Engineers | 1,028,004 |
| 66 | Mazzetti | 1,013,140 |
| 67 | Rist-Frost-Shumway Engineering | 1,000,000 |
| 68 | Guernsey | 958,526 |
| 69 | Ross & Baruzzini | 828,783 |
| 70 | Apogee Consulting Group | 815,250 |
| 71 | GRW | 562,957 |
| 72 | CRB | 495,240 |
| 73 | Zak Companies | 458,187 |
| 74 | Davis, Bowen & Friedel | 331,004 |
| 75 | Wallace Engineering | 310,000 |
| 76 | French & Parrello Associates | 264,900 |
| 77 | Primera Engineers | 253,000 |
| 78 | RMF Engineering | 150,000 |
| 79 | Integrated Design Group | 137,118 |
| 80 | P2S Engineering | 135,228 |
| 81 | Spectrum Engineers | 85,926 |
| 82 | Stanley Consultants | 12,178 |
| 83 | Total Building Commissioning | 4,798 |
Top Office Sector Construction Firms
| Rank | Company | 2013 Office Revenue |
| 1 | Turner Construction | $1,965,630,000 |
| 2 | Structure Tone | 1,770,996,000 |
| 3 | Balfour Beatty US | 1,083,107,816 |
| 4 | PCL Construction | 965,124,704 |
| 5 | Gilbane | 850,668,144 |
| 6 | Clark Group | 768,213,069 |
| 7 | Skanska USA | 756,888,741 |
| 8 | Hensel Phelps | 595,480,000 |
| 9 | Suffolk Construction | 575,149,178 |
| 10 | HITT Contracting | 510,600,000 |
| 11 | Whiting-Turner Contracting Co., The | 483,040,306 |
| 12 | Hathaway Dinwiddie Construction | 478,000,000 |
| 13 | Clayco | 474,300,000 |
| 14 | DPR Construction | 419,864,261 |
| 15 | James G. Davis Construction | 409,209,373 |
| 16 | Holder Construction | 375,561,000 |
| 17 | Clune Construction | 350,356,681 |
| 18 | Walsh Group, The | 330,591,769 |
| 19 | JE Dunn Construction | 319,712,834 |
| 20 | Tutor Perini Corp. | 299,785,799 |
| 21 | Plaza Construction | 281,000,000 |
| 22 | Brasfield & Gorrie | 255,289,660 |
| 23 | Lend Lease | 203,243,000 |
| 24 | Ryan Companies US | 198,980,348 |
| 25 | Manhattan Construction | 195,656,000 |
| 26 | Choate Construction | 176,908,443 |
| 27 | Parsons Brinckerhoff | 158,130,489 |
| 28 | McGough | 144,000,000 |
| 29 | Austin Commercial | 126,751,064 |
| 30 | Swinerton Builders | 125,070,000 |
| 31 | McShane Companies, The | 120,701,443 |
| 32 | Pepper Construction | 116,840,000 |
| 33 | Mortenson Construction | 114,140,000 |
| 34 | JLL | 107,497,010 |
| 35 | Linbeck Group | 105,400,000 |
| 36 | C.W. Driver | 102,470,000 |
| 37 | Shawmut Design and Construction | 93,000,000 |
| 38 | B. L. Harbert International | 92,475,153 |
| 39 | CORE Construction Group | 91,118,620 |
| 40 | Leopardo Companies | 90,583,950 |
| 41 | McCarthy Holdings | 84,700,000 |
| 42 | Consigli Construction | 82,688,033 |
| 43 | Messer Construction | 75,756,377 |
| 44 | Power Construction | 67,000,000 |
| 45 | Hoar Construction | 66,258,000 |
| 46 | Weitz Company, The | 65,679,309 |
| 47 | Robins & Morton | 64,633,817 |
| 48 | Sundt Construction | 63,414,544 |
| 49 | Beck Group, The | 61,444,072 |
| 50 | Hill International | 61,000,000 |
| 51 | Yates Companies, The | 50,000,000 |
| 52 | URS Corp. | 49,783,891 |
| 53 | Hunt Construction Group | 46,000,000 |
| 54 | Fortis Construction | 41,800,000 |
| 55 | Adolfson & Peterson Construction | 40,492,626 |
| 56 | LeChase Construction Services | 39,360,000 |
| 57 | Bomel Construction | 38,747,785 |
| 58 | Rodgers Builders | 37,126,784 |
| 59 | Paric Corp. | 35,000,000 |
| 60 | Haselden Construction | 30,679,991 |
| 61 | IMC Construction | 30,597,000 |
| 62 | Barton Malow | 28,706,771 |
| 63 | Haskell | 28,625,841 |
| 64 | Coakley & Williams Construction | 26,086,629 |
| 65 | New South Construction | 22,590,000 |
| 66 | Flintco | 22,000,000 |
| 67 | EMJ Corp. | 21,000,000 |
| 68 | Layton Construction | 20,800,000 |
| 69 | E.W. Howell | 20,491,000 |
| 70 | O'Neil Industries/W.E. O'Neil | 20,354,165 |
| 71 | Heery International | 20,011,958 |
| 72 | Kitchell Corp. | 19,231,158 |
| 73 | Hill & Wilkinson | 19,149,000 |
| 74 | Walbridge | 18,100,000 |
| 75 | Wight & Company | 16,827,000 |
| 76 | Harkins Builders | 16,300,000 |
| 77 | James McHugh Construction | 14,829,260 |
| 78 | Hoffman Construction | 14,000,000 |
| 79 | Kraus-Anderson Construction | 10,000,000 |
| 80 | Batson-Cook | 8,329,557 |
| 81 | Gray Construction | 7,600,000 |
| 82 | Stalco Construction | 7,380,000 |
| 83 | Allen & Shariff | 7,200,000 |
| 84 | Boldt Company, The | 7,044,051 |
| 85 | Bernards | 6,700,000 |
| 86 | W. M. Jordan Company | 6,575,178 |
| 87 | Graycor | 6,456,452 |
| 88 | KBE Building Corp. | 5,964,801 |
| 89 | STV | 5,339,000 |
| 90 | Weis Builders | 5,031,000 |
| 91 | Bette Companies, The | 4,834,000 |
| 92 | Alberici Constructors | 2,961,966 |
| 93 | Absher Construction | 2,256,599 |
| 94 | S. M. Wilson & Co. | 1,607,814 |
| 95 | Douglas Company, The | 1,479,136 |
| 96 | LPCiminelli | 1,349,300 |
| 97 | Astorino | 1,334,650 |
Read BD+C's full 2014 Giants 300 Report
Related Stories
| Mar 12, 2014
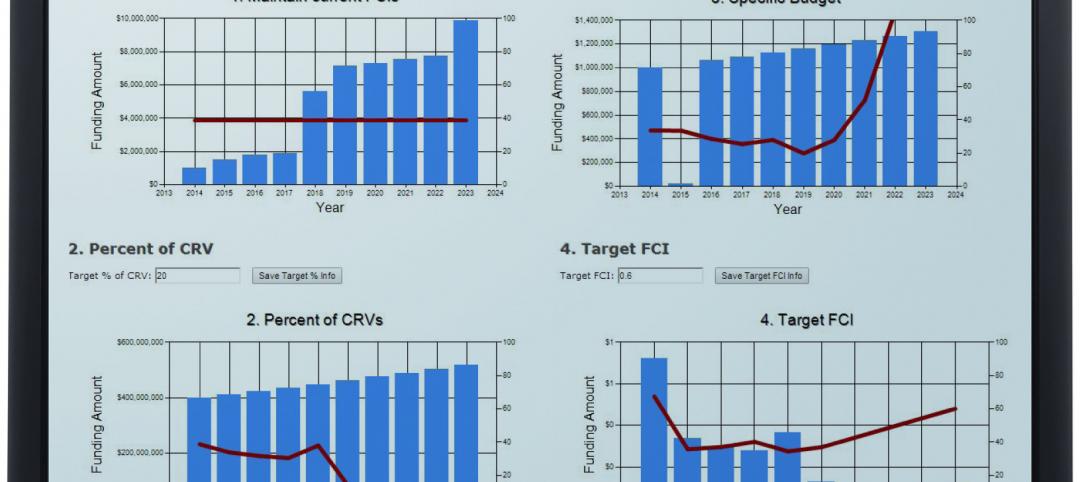
New CannonDesign database allows users to track facility assets
The new software identifies critical failures of components and systems, code and ADA-compliance issues, and systematically justifies prudent expenditures.
")
| Mar 11, 2014
7 (more) awe-inspiring interior designs [slideshow]
The seven winners of the 41st Interior Design Competition and the 22nd Will Ching Design Competition include projects on four different continents.

| Mar 11, 2014
Freelon Group to join Perkins+Will
The Freelon Group concentrates on museums, libraries, universities and other civic and institutional clients; Perkins+Will plans to incorporate this specialization into their design repertory.

| Mar 10, 2014
Meet Tally – the Revit app that calculates the environmental impact of building materials
Tally provides AEC professionals with insight into how materials-related decisions made during design influence a building’s overall ecological footprint.

Sponsored | | Mar 10, 2014
A high-performance barn
Bastoni Vineyards replaces a wooden barn with an efficient metal building used for maintenance, storage, and hosting events.

| Mar 10, 2014
Field tested: Caterpillar’s Cat B15 rugged smartphone
The B15 is billed by Cat as “the most progressive, durable and rugged device available on the market today.”

| Mar 10, 2014
5 rugged mobile devices geared for construction pros
BD+C readers share their most trusted smartphone and tablet cases. The editors select some of their faves, too.

| Mar 7, 2014
Thom Mayne's high-tech Emerson College LA campus opens in Hollywood [slideshow]
The $85 million, 10-story vertical campus takes the shape of a massive, shimmering aircraft hangar, housing a sculptural, glass-and-aluminum base building.

| Mar 7, 2014
Learning from common leadership errors
As a leader in the AEC world, you’ll likely find yourself making certain mistakes over the course of your career. Here are a few common leadership errors that can easily be avoided.
| Mar 6, 2014
BD+C wants to hear about your breakthrough ideas and projects for the Giants 300 report
BD+C's 2014 Giants 300 survey form is now available. But completing the survey is just one way to participate in the July Giants issue.


