


The office market continues to improve, with many projects in development. Rents are rising as vacancy decreases, according to Jones Lang LaSalle’s 2014 U.S. Office Outlook (http://bit.ly/1ildrS7). Dozens of markets are classified as experiencing a “rising phase” (among them, Phoenix, Chicago, Salt Lake City, and Atlanta), while Dallas, Houston, San Francisco, and the Silicon Valley are believed to be peaking.
New-construction leaders include Houston and New York City, and even in calmer markets, AEC firms are busy with workplace fitouts and renovations.
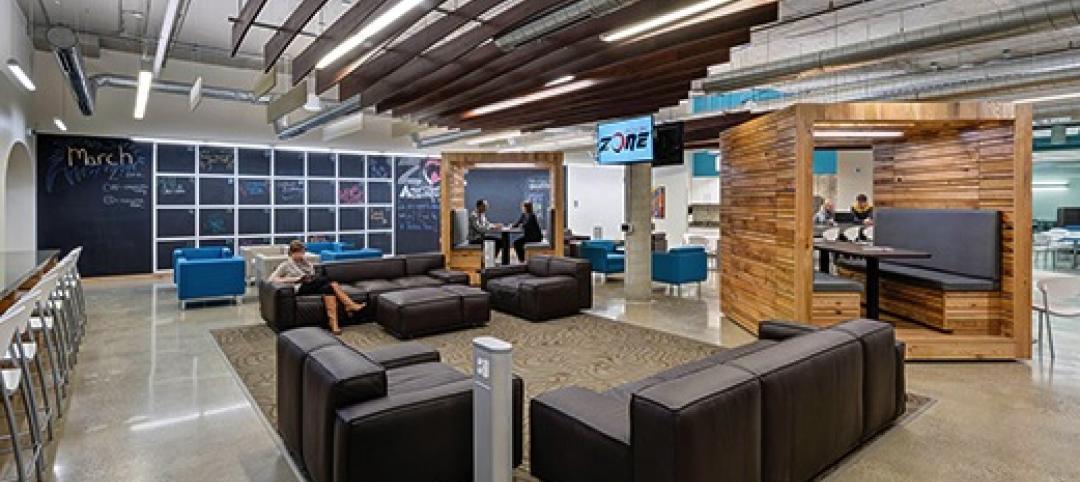
The adage “doing more with less” has become a byword for many businesses since the Great Recession, and clients are trying to maximize every precious inch. “Everyone is looking to use less space,” says Daniel P. Perruzzi, Jr., AIA, LEED AP, Principal at Boston-based Margulies Perruzzi Architects. “They’re looking at ways to modify their office and workplace standards so that they can fit into less.”
Hierarchical office assignments are becoming passé, as is the notion that people will stay in their cubicles for much of the day. “A lot of companies are going down to a single size for offices, so they’re not awarding that space on the basis of rank,” notes Perruzzi. “And as a rule, companies are looking to change the ratio between offices and open workstations. It’s all driven by collaboration.”
Non-assigned space concepts continue to gain popularity. Whether or not they’re actual telecommuters, workers on the move require well-considered accommodations, including easily accessible plug-ins for laptops, tablets, and smartphones. Says Perruzzi, “You have to think about the accommodations both technically and physically. Workers want to be able to plug in their devices and see their desktop no matter which workstation they’re using.”
Analyses by experts like CoreNet Global indicate that space per worker may drop below 100 sf within five years. Perruzzi says workstations won’t necessarily keep shrinking but will likely keep reducing in number. Margulies Perruzzi’s design for Philips North America’s first Workplace Innovation Center involved no private offices and 200 physical workstations for about 260 employees. Called “free addressing,” the plan allows employees to migrate from desk to desk while reducing the number of empty spots left by workers who are off-site.
Says Perruzzi: “There’s no such thing as an individual contributor anymore. It’s about people working in teams that change on a regular basis, are very dynamic, and need constant access to each other.”
Top Office Sector Architecture Firms
| Rank | Company | 2013 Office Revenue |
| 1 | Gensler | $472,552,752 |
| 2 | HOK | 141,723,793 |
| 3 | Perkins+will | 112,815,842 |
| 4 | Skidmore, Owings & Merrill | 83,599,900 |
| 5 | NBBJ | 64,107,000 |
| 6 | Stantec | 62,594,213 |
| 7 | ZGF Architects | 43,902,072 |
| 8 | Page | 37,460,000 |
| 9 | Kohn Pedersen Fox Associates | 36,176,000 |
| 10 | Nelson | 36,089,550 |
| 11 | SmithGroupJJR | 35,614,366 |
| 12 | Hammel, Green and Abrahamson | 33,267,365 |
| 13 | RTKL Associates | 30,705,000 |
| 14 | EYP Architecture & Engineering | 30,000,000 |
| 15 | CannonDesign | 29,000,000 |
| 16 | HKS | 26,255,885 |
| 17 | Corgan | 24,977,990 |
| 18 | HDR | 24,700,000 |
| 19 | RSP Architects | 23,106,000 |
| 20 | Leo A Daly | 20,101,466 |
| 21 | Heery International | 20,011,958 |
| 22 | LS3P | 17,522,964 |
| 23 | Ware Malcomb | 17,500,000 |
| 24 | Kirksey | 15,989,864 |
| 25 | LPA | 15,875,503 |
| 26 | Perkins Eastman | 15,000,000 |
| 27 | NORR | 14,244,421 |
| 28 | Goettsch Partners | 12,070,000 |
| 29 | VOA Associates | 11,040,757 |
| 30 | Epstein | 10,752,000 |
| 31 | CTA Architects Engineers | 10,438,159 |
| 32 | Margulies Perruzzi Architects | 10,191,746 |
| 33 | Cuningham Group Architecture | 10,068,814 |
| 34 | BRPH | 9,906,000 |
| 35 | DLR Group | 9,800,000 |
| 36 | Environetics | 9,612,351 |
| 37 | Vocon | 9,203,152 |
| 38 | RNL | 8,941,000 |
| 39 | Gresham, Smith and Partners | 8,768,000 |
| 40 | Ziegler Cooper | 8,676,816 |
| 41 | Davis Brody Bond | 8,369,474 |
| 42 | FXFOWLE Architects | 7,880,000 |
| 43 | Adrian Smith + Gordon Gill Architecture | 7,750,000 |
| 44 | Clark Nexsen | 7,707,493 |
| 45 | LMN Architects | 7,368,900 |
| 46 | Little | 7,253,565 |
| 47 | Cooper Carry | 7,227,738 |
| 48 | Symmes Maini & McKee Associates | 6,490,000 |
| 49 | WDG Architecture | 5,844,000 |
| 50 | Solomon Cordwell Buenz | 5,300,000 |
| 51 | Carrier Johnson + Culture | 5,118,818 |
| 52 | Swanke Hayden Connell Architects | 4,990,000 |
| 53 | Eppstein Uhen Architects | 4,972,955 |
| 54 | Fentress Architects | 4,551,790 |
| 55 | Francis Cauffman | 4,187,463 |
| 56 | Wight & Company | 3,683,000 |
| 57 | Smallwood, Reynolds, Stewart, Stewart & Associates | 3,653,284 |
| 58 | OZ Architecture | 3,625,600 |
| 59 | GBBN Architects | 3,540,500 |
| 60 | Callison | 3,481,227 |
| 61 | HMC Architects | 3,388,658 |
| 62 | Albert Kahn Associates | 3,297,848 |
| 63 | Baskervill | 3,226,678 |
| 64 | Rule Joy Trammell + Rubio | 3,120,000 |
| 65 | Montroy Andersen DeMarco | 3,107,000 |
| 66 | Goodwyn Mills & Cawood | 2,932,849 |
| 67 | Good Fulton & Farrell | 2,928,000 |
| 68 | JRS Architect | 2,850,000 |
| 69 | HNTB Corp. | 2,793,299 |
| 70 | Ratio Architects | 2,720,819 |
| 71 | Inventure Design Group | 2,711,701 |
| 72 | ai Design Group | 2,663,516 |
| 73 | KZF Design | 2,544,819 |
| 74 | EwingCole | 2,510,000 |
| 75 | RS&H | 2,450,000 |
| 76 | Integrus Architecture | 2,410,899 |
| 77 | MulvannyG2 Architecture | 2,200,000 |
| 78 | Wilson Architects | 2,200,000 |
| 79 | Rosser International | 1,921,665 |
| 80 | Hoffmann Architects | 1,602,000 |
| 81 | Beyer Blinder Belle | 1,496,952 |
| 82 | LaBella Associates | 1,493,586 |
| 83 | Hnedak Bobo Group | 1,339,000 |
| 84 | Commonwealth Architects | 1,212,741 |
| 85 | Hord Coplan Macht | 1,113,153 |
| 86 | MBH Architects | 1,090,000 |
| 87 | PGAL | 1,074,700 |
| 88 | Nadel | 1,000,000 |
| 88 | Polytech Associates | 1,000,000 |
| 90 | P+R Architects | 982,666 |
| 91 | Parkhill, Smith & Cooper | 945,000 |
| 92 | Bergmann Associates | 939,420 |
| 93 | Niles Bolton Associates | 840,919 |
| 94 | Moseley Architects | 744,501 |
| 95 | Moody Nolan | 722,616 |
| 96 | H+L Architecture | 711,172 |
| 97 | EDI International | 630,916 |
| 98 | BLTa | 630,000 |
| 99 | H3 Hardy Collaboration Architecture | 611,898 |
| 100 | Hoefer Wysocki Architecture | 605,000 |
| 101 | WATG | Wimberly Interiors | 568,000 |
| 102 | Cambridge Seven Associates | 460,000 |
| 103 | Morris Architects | 335,000 |
| 104 | Emersion Design | 332,073 |
| 105 | DLA Architects | 317,730 |
| 106 | BLDD Architects | 280,000 |
| 107 | Hastings+Chivetta Architects | 243,171 |
| 108 | DesignGroup | 242,580 |
| 109 | Sherlock, Smith & Adams | 235,000 |
| 110 | Slaterpaull Architects | 230,000 |
| 111 | FitzGerald Associates Architects | 210,500 |
| 112 | Poskanzer Skott | 200,000 |
| 113 | SchenkelShultz Architecture | 197,000 |
| 114 | PHX Architecture | 180,000 |
| 115 | FGM Architects | 179,784 |
| 116 | BSA LifeStructures | 174,437 |
Top Office Sector Engineering Firms
| Rank | Company | 2013 Office Revenue |
| 1 | AECOM Technology Corp. | $964,240,000 |
| 2 | Jacobs | 504,890,000 |
| 3 | Parsons Brinckerhoff | 158,130,489 |
| 4 | Burns & McDonnell | 102,620,000 |
| 5 | Thornton Tomasetti | 63,427,107 |
| 6 | URS Corp. | 49,783,891 |
| 7 | WSP Group | 49,230,000 |
| 8 | Arup | 43,201,720 |
| 9 | H&A Architects & Engineers | 36,000,000 |
| 10 | Leidos | 28,150,000 |
| 11 | AKF Group | 27,835,000 |
| 12 | KPFF Consulting Engineers | 27,000,000 |
| 13 | Syska Hennessy Group | 26,817,533 |
| 14 | Magnusson Klemencic Associates | 16,437,499 |
| 15 | Wiss, Janney, Elstner Associates | 14,220,000 |
| 16 | Glumac | 14,102,479 |
| 17 | Dewberry | 13,478,149 |
| 18 | Bala Consulting Engineers | 12,507,000 |
| 19 | Environmental Systems Design | 12,505,965 |
| 20 | RDK Engineers | 10,690,000 |
| 21 | Vanderweil Engineers | 10,533,700 |
| 22 | GHT Limited | 9,665,000 |
| 23 | Simpson Gumpertz & Heger | 7,430,000 |
| 24 | Allen & Shariff | 7,200,000 |
| 25 | KCI Technologies | 6,400,000 |
| 26 | Walter P Moore and Associates | 6,002,650 |
| 27 | Highland Associates | 6,000,000 |
| 28 | STV | 5,339,000 |
| 29 | DeSimone Consulting Engineers | 5,084,661 |
| 30 | Aon Fire Protection Engineering Corp. | 5,000,000 |
| 31 | Hixson Architecture, Engineering, Interiors | 5,000,000 |
| 32 | SSOE Group | 4,656,959 |
| 33 | H.F. Lenz | 4,362,698 |
| 34 | Joseph R. Loring & Associates | 4,000,000 |
| 35 | KLH Engineers | 3,875,841 |
| 36 | M-E Engineers | 3,863,000 |
| 37 | Newcomb & Boyd | 3,802,993 |
| 38 | Sparling | 3,799,152 |
| 39 | Bridgers & Paxton Consulting Engineers | 3,612,041 |
| 40 | Smith Seckman Reid | 3,508,905 |
| 41 | Affiliated Engineers | 3,104,000 |
| 42 | Interface Engineering | 2,946,713 |
| 43 | Martin/Martin | 2,793,639 |
| 44 | KJWW Engineering Consultants | 2,711,604 |
| 45 | I. C. Thomasson Associates | 2,600,000 |
| 46 | TLC Engineering for Architecture | 2,329,558 |
| 47 | Henderson Engineers | 2,269,347 |
| 48 | ThermalTech Engineering | 2,250,000 |
| 49 | Heapy Engineering | 2,145,190 |
| 50 | CJL Engineering | 1,878,330 |
| 51 | Dunham Associates | 1,750,000 |
| 52 | Wick Fisher White | 1,734,113 |
| 53 | Karpinski Engineering | 1,695,420 |
| 54 | Shive-Hattery | 1,581,161 |
| 55 | CTLGroup | 1,560,000 |
| 56 | Graef | 1,469,354 |
| 57 | Paulus, Sokolowski and Sartor | 1,400,000 |
| 58 | OLA Consulting Engineers | 1,398,000 |
| 59 | TTG | 1,383,325 |
| 60 | Kamm Consulting | 1,344,151 |
| 61 | CCRD Partners | 1,270,000 |
| 62 | G&W Engineering Corp. | 1,091,000 |
| 63 | M/E Engineering | 1,034,842 |
| 64 | Brinjac Engineering | 1,032,104 |
| 65 | Coffman Engineers | 1,028,004 |
| 66 | Mazzetti | 1,013,140 |
| 67 | Rist-Frost-Shumway Engineering | 1,000,000 |
| 68 | Guernsey | 958,526 |
| 69 | Ross & Baruzzini | 828,783 |
| 70 | Apogee Consulting Group | 815,250 |
| 71 | GRW | 562,957 |
| 72 | CRB | 495,240 |
| 73 | Zak Companies | 458,187 |
| 74 | Davis, Bowen & Friedel | 331,004 |
| 75 | Wallace Engineering | 310,000 |
| 76 | French & Parrello Associates | 264,900 |
| 77 | Primera Engineers | 253,000 |
| 78 | RMF Engineering | 150,000 |
| 79 | Integrated Design Group | 137,118 |
| 80 | P2S Engineering | 135,228 |
| 81 | Spectrum Engineers | 85,926 |
| 82 | Stanley Consultants | 12,178 |
| 83 | Total Building Commissioning | 4,798 |
Top Office Sector Construction Firms
| Rank | Company | 2013 Office Revenue |
| 1 | Turner Construction | $1,965,630,000 |
| 2 | Structure Tone | 1,770,996,000 |
| 3 | Balfour Beatty US | 1,083,107,816 |
| 4 | PCL Construction | 965,124,704 |
| 5 | Gilbane | 850,668,144 |
| 6 | Clark Group | 768,213,069 |
| 7 | Skanska USA | 756,888,741 |
| 8 | Hensel Phelps | 595,480,000 |
| 9 | Suffolk Construction | 575,149,178 |
| 10 | HITT Contracting | 510,600,000 |
| 11 | Whiting-Turner Contracting Co., The | 483,040,306 |
| 12 | Hathaway Dinwiddie Construction | 478,000,000 |
| 13 | Clayco | 474,300,000 |
| 14 | DPR Construction | 419,864,261 |
| 15 | James G. Davis Construction | 409,209,373 |
| 16 | Holder Construction | 375,561,000 |
| 17 | Clune Construction | 350,356,681 |
| 18 | Walsh Group, The | 330,591,769 |
| 19 | JE Dunn Construction | 319,712,834 |
| 20 | Tutor Perini Corp. | 299,785,799 |
| 21 | Plaza Construction | 281,000,000 |
| 22 | Brasfield & Gorrie | 255,289,660 |
| 23 | Lend Lease | 203,243,000 |
| 24 | Ryan Companies US | 198,980,348 |
| 25 | Manhattan Construction | 195,656,000 |
| 26 | Choate Construction | 176,908,443 |
| 27 | Parsons Brinckerhoff | 158,130,489 |
| 28 | McGough | 144,000,000 |
| 29 | Austin Commercial | 126,751,064 |
| 30 | Swinerton Builders | 125,070,000 |
| 31 | McShane Companies, The | 120,701,443 |
| 32 | Pepper Construction | 116,840,000 |
| 33 | Mortenson Construction | 114,140,000 |
| 34 | JLL | 107,497,010 |
| 35 | Linbeck Group | 105,400,000 |
| 36 | C.W. Driver | 102,470,000 |
| 37 | Shawmut Design and Construction | 93,000,000 |
| 38 | B. L. Harbert International | 92,475,153 |
| 39 | CORE Construction Group | 91,118,620 |
| 40 | Leopardo Companies | 90,583,950 |
| 41 | McCarthy Holdings | 84,700,000 |
| 42 | Consigli Construction | 82,688,033 |
| 43 | Messer Construction | 75,756,377 |
| 44 | Power Construction | 67,000,000 |
| 45 | Hoar Construction | 66,258,000 |
| 46 | Weitz Company, The | 65,679,309 |
| 47 | Robins & Morton | 64,633,817 |
| 48 | Sundt Construction | 63,414,544 |
| 49 | Beck Group, The | 61,444,072 |
| 50 | Hill International | 61,000,000 |
| 51 | Yates Companies, The | 50,000,000 |
| 52 | URS Corp. | 49,783,891 |
| 53 | Hunt Construction Group | 46,000,000 |
| 54 | Fortis Construction | 41,800,000 |
| 55 | Adolfson & Peterson Construction | 40,492,626 |
| 56 | LeChase Construction Services | 39,360,000 |
| 57 | Bomel Construction | 38,747,785 |
| 58 | Rodgers Builders | 37,126,784 |
| 59 | Paric Corp. | 35,000,000 |
| 60 | Haselden Construction | 30,679,991 |
| 61 | IMC Construction | 30,597,000 |
| 62 | Barton Malow | 28,706,771 |
| 63 | Haskell | 28,625,841 |
| 64 | Coakley & Williams Construction | 26,086,629 |
| 65 | New South Construction | 22,590,000 |
| 66 | Flintco | 22,000,000 |
| 67 | EMJ Corp. | 21,000,000 |
| 68 | Layton Construction | 20,800,000 |
| 69 | E.W. Howell | 20,491,000 |
| 70 | O'Neil Industries/W.E. O'Neil | 20,354,165 |
| 71 | Heery International | 20,011,958 |
| 72 | Kitchell Corp. | 19,231,158 |
| 73 | Hill & Wilkinson | 19,149,000 |
| 74 | Walbridge | 18,100,000 |
| 75 | Wight & Company | 16,827,000 |
| 76 | Harkins Builders | 16,300,000 |
| 77 | James McHugh Construction | 14,829,260 |
| 78 | Hoffman Construction | 14,000,000 |
| 79 | Kraus-Anderson Construction | 10,000,000 |
| 80 | Batson-Cook | 8,329,557 |
| 81 | Gray Construction | 7,600,000 |
| 82 | Stalco Construction | 7,380,000 |
| 83 | Allen & Shariff | 7,200,000 |
| 84 | Boldt Company, The | 7,044,051 |
| 85 | Bernards | 6,700,000 |
| 86 | W. M. Jordan Company | 6,575,178 |
| 87 | Graycor | 6,456,452 |
| 88 | KBE Building Corp. | 5,964,801 |
| 89 | STV | 5,339,000 |
| 90 | Weis Builders | 5,031,000 |
| 91 | Bette Companies, The | 4,834,000 |
| 92 | Alberici Constructors | 2,961,966 |
| 93 | Absher Construction | 2,256,599 |
| 94 | S. M. Wilson & Co. | 1,607,814 |
| 95 | Douglas Company, The | 1,479,136 |
| 96 | LPCiminelli | 1,349,300 |
| 97 | Astorino | 1,334,650 |
Read BD+C's full 2014 Giants 300 Report
Related Stories

| Oct 23, 2014
Santiago Calatrava-designed church breaks ground in Lower Manhattan
Saturday marked the public "ground blessing" ceremony for the Saint Nicholas National Shrine, the Greek Orthodox Church destroyed on 9/11 by the collapse of the World Trade Center towers.

| Oct 23, 2014
Prehistory museum's slanted roof mimics archaeological excavation [slideshow]
Mimicking the unearthing of archaeological sites, Henning Larsen Architects' recently opened Moesgaard Museum in Denmark has a planted roof that slopes upward out of the landscape.

| Oct 23, 2014
China's 'weird' buildings: President Xi Jinping wants no more of them
During a literary symposium in Beijing, Chinese President Xi Jinping urged architects, authors, actors, and other artists to produce work with "artistic and moral value."

| Oct 23, 2014
Architecture Billings Index shows strong demand for institutional, mixed-practice design
AIA reported the September ABI score was 55.2, up from a mark of 53.0 in August. This score reflects an increase in design activity.
| Oct 22, 2014
Customization is the key in tomorrow's workplace
The importance of mobility, flexibility, and sustainability in the world of corporate design are already well-established. A newer trend that’s gaining deserved attention is customizability, and how it will look in the coming years, writes GS&P's Leith Oatman.

| Oct 21, 2014
Passive House concept gains momentum in apartment design
Passive House, an ultra-efficient building standard that originated in Germany, has been used for single-family homes since its inception in 1990. Only recently has the concept made its way into the U.S. commercial buildings market.

| Oct 21, 2014
Hartford Hospital plans $150 million expansion for Bone and Joint Institute
The bright-white structures will feature a curvilinear form, mimicking bones and ligament.

| Oct 21, 2014
Norman Foster, Zaha Hadid release plans for resorts in Nanjing and Wuhan, China
Jumeirah Group, a hotel group forming a part of investment group Dubai Holding, has chosen Zaha Hadid and Norman Foster to design two of three of its proposed resorts in Nanjing, Wuhan, and Haikou.

| Oct 21, 2014
Inside LEED v4: The view from the MEP engineering seats
Much of the spirited discussion around LEED v4 has been centered on the Materials & Resources Credit. At least one voice in the wilderness is shouting for greater attention to another huge change in LEED: the shift to ASHRAE 90.1-2010 as the new reference standard for Energy & Atmosphere prerequisites and credits.

| Oct 21, 2014
Perkins Eastman white paper explores state of the senior living industry in the Carolinas
Among the experts interviewed for the white paper, there was a general consensus that the model for continuing-care retirement communities is changing, driven by both the changing consumers and more prevalent global interest on the effects of aging.


