

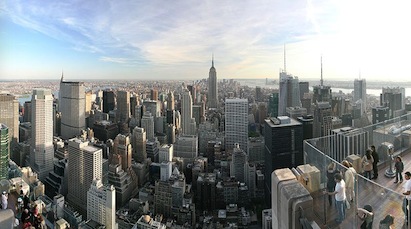
A new study released by the Mayor’s office shows that New York City is making great strides in identifying energy wasted from its largest source of climate change pollution: its buildings.
The report provides information on energy performance of the city’s largest buildings (mostly commercial, multi-family residential). It provides an analysis of 2011 data from city-required energy “benchmarking”—or the tracking and comparison of energy performance—in more than 24,000 buildings that are over 50,000 square feet.
This report is a follow-up to one the city released in 2012. Last year’s report was remarkable in that it gave an initial glimpse into how New York City’s buildings use energy. This year’s report is the first time that such a rich two-year dataset has ever been available for comparative analysis. Now we can really begin to see trends and to pose new questions.
Along with this year’s report, the city is also releasing detailed disclosure data for the city’s largest multi-family residential buildings (meaning residents can actually look up their building’s address and find its energy usage information). This is not only the first time New York City has done that – but the first time any city in the country has made this kind of detailed information publicly available for large multi-family buildings. It will be joined within a few years by Chicago and Washington, DC. Just as we read nutrition labels or compare MPG when buying a car, millions of New Yorkers now have transparent information about their apartment buildings’ energy use. (For more information on what this data reveals about these multi-family buildings, check out this blog from the folks at the Institute for Market Transformation.)
Why does any of this matter? According to the City’s most recent inventory, 74% of citywide greenhouse gas emissions come from the energy used in its buildings. And of that, more than half comes from energy used in just 2% of the largest properties. Those 2% are required to benchmark and disclose their energy use in accordance with a city law that is designed to cut emissions citywide (30% by 2030). By tracking and disclosing this information on building energy performance, we can better understand the problem and how to fix it. This can help reduce climate change pollution and lower buildings’ energy bills.
Today’s report is a testament to New York City’s leadership in embracing benchmarking as a means to improving energy efficiency and combating climate change. And this report offers the largest-ever collection of benchmarking data for a single jurisdiction in the nation – providing more information on building energy use than 7 other cities that are tracking this information combined (Austin, Boston, Minneapolis, Philadelphia, San Francisco, Seattle, and DC).
Here’s a quick overview of this new report’s top findings:
- NYC’s buildings are more efficient than the national average – although their efficiency seems to be quite similar to buildings in the Northeast. This could be that buildings in the Northeast, including NYC, are generally older and more solidly built in comparison to the rest of the U.S. (It may surprise some to know that older NYC office buildings, for example, tend to be more efficient than new office construction has been in recent years.) Another factor might be that NYC’s buildings are more intensively used, both in terms of occupant density and operating hours. To be able to fairly compare similar buildings across the country, the ENERGY STAR rating takes key drivers of energy consumption in different building types into account. These include operational characteristics (like the number of workers and hours of use) and weather (warmer or cooler climates). This information is helping show the City where to best focus its efforts when boosting energy efficiency.
- Not all NYC buildings are created equal. NYC buildings that are home to retail businesses showed a huge range in energy intensity – think large chain stores vs. your mom-and-pop shops. The most energy-intensive retail buildings used five times more energy per square foot than the least intensive users. Meanwhile, multifamily residential buildings showed only a small variation in energy consumption between the most and least intensive users. These findings are intriguing and point to the opportunity for energy conservation programs aimed at different building uses and types.
- The city’s median ENERGY STAR score increased from 64 to 67. ENERGY STAR is the standard benchmark used by jurisdictions across the country to rate the efficiency of their buildings. This is a trend that we should watch in future reports to determine whether there is a true increase in NYC building efficiency -- especially as the impacts of Greener, Greater Buildings Plan laws kick in over the next few years.
In addition to identifying these broad takeaways from the raw data, the report draws attention to a couple of excellent local benchmarking success stories—one commercial office building, and one multi-family residential property. These stories show how the city’s benchmarking program is helping to save building owners money and reduce climate change pollution in each sector.
Commercial Building Benchmarking Success Story: 5 Penn Plaza
The benchmarking process allowed building managers at 5 Penn Plaza—a typical large office building in Manhattan—to identify how much energy they were using and uncover opportunities to reduce their usage. As a result, they have taken strides to improve their efficiency. This includes upgrading common area lighting, installing occupancy sensors in restrooms, putting timers on hot water heaters to prevent excess usage during periods of vacancy, installing pipe insulation, installing a boiler efficiency module, and installing efficient lighting and occupancy sensors during the fit-out of a new full floor tenant. As a result, they have saved money and reduced their fuel oil use by 25%, qualified for special ENERGY STAR recognition, and decreased their overall energy intensity by 5%.
Residential Building Benchmarking Success Story: 250 Cabrini Boulevard
Due to building upgrades identified in an energy audit, 250 Cabrini Boulevard—a 77-unit coop in Manhattan—is saving almost $11,000 a year in operational costs and has lowered its maintenance expenses. One of the improvements included a new boiler control that responds to interior apartment and outdoor temperatures. Not only are the residents are more comfortable, but their coop is saving money. Even though the latest round of reported benchmarking data includes only a few months of usage after the upgrades it shows that the building saw a 6% reduction in its fuel oil consumption. And, the latest data is showing that they managed to reduce their further heating fuel usage by 21% over the entire 2011-2012 heating season.
NYC’s benchmarking law is helping to shepherd in a new era of energy awareness and improvement. And, because the City also requires that buildings disclose their benchmarking scores, owners can compare their buildings to their peers’. This awareness can help building tenants, operators and businesses uncover major energy savings while unlocking market-driven demand for energy-efficiency products and local skilled workers.
It is no wonder that nine major U.S. cities have adopted similar policies as the basis for their efforts to reduce the huge amount of wasted energy in America’s existing buildings. Which cities are next?
Related Stories

Resiliency | Aug 7, 2023
Creative ways cities are seeking to beat urban heat gain
As temperatures in many areas hit record highs this summer, cities around the world are turning to creative solutions to cope with the heat. Here are several creative ways cities are seeking to beat urban heat gain.

Government Buildings | Aug 7, 2023
Nearly $1 billion earmarked for energy efficiency upgrades to federal buildings
The U.S. General Services Administration (GSA) recently announced plans to use $975 million in Inflation Reduction Act funding for energy efficiency and clean energy upgrades to federal buildings across the country. The investment will impact about 40 million sf, or about 20% of GSA’s federal buildings portfolio.

MFPRO+ New Projects | Aug 4, 2023
Nashville gets 'first-of-its-kind' residential tower
Global architecture firm Goettsch Partners announces the completion of Alcove, a new 356-unit residential tower in Nashville, Tenn., developed by Giarratana LLC.
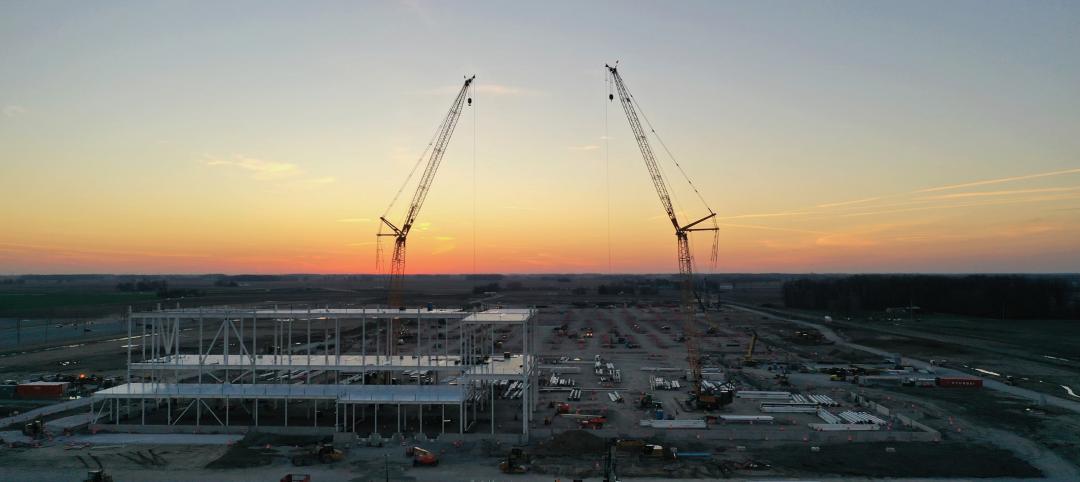
Industrial Facilities | Aug 3, 2023
The state of battery manufacturing in the era of EV
One of the most significant changes seen in today’s battery plant is the full manufacturing process—from raw materials to the fully operational battery.

Government Buildings | Aug 2, 2023
A historic courthouse in Charlotte is updated and expanded by Robert A.M. Stern Architects
Robert A.M. Stern Architects’ design retains the original building’s look and presence.

Hotel Facilities | Aug 2, 2023
Top 5 markets for hotel construction
According to the United States Construction Pipeline Trend Report by Lodging Econometrics (LE) for Q2 2023, the five markets with the largest hotel construction pipelines are Dallas with a record-high 184 projects/21,501 rooms, Atlanta with 141 projects/17,993 rooms, Phoenix with 119 projects/16,107 rooms, Nashville with 116 projects/15,346 rooms, and Los Angeles with 112 projects/17,797 rooms.

Architects | Aug 1, 2023
Ware Malcomb announces hire of Jason Golub as Regional Director
In this role, Golub is responsible for the overall leadership and continued growth of the office.

Market Data | Aug 1, 2023
Nonresidential construction spending increases slightly in June
National nonresidential construction spending increased 0.1% in June, according to an Associated Builders and Contractors analysis of data published today by the U.S. Census Bureau. Spending is up 18% over the past 12 months. On a seasonally adjusted annualized basis, nonresidential spending totaled $1.07 trillion in June.

Healthcare Facilities | Aug 1, 2023
Top 10 healthcare design projects for 2023
The HKS-designed Allegheny Health Network Wexford (Pa.) Hospital and Flad Architects' Sarasota Memorial Hospital - Venice (Fla.) highlight 10 projects to win 2023 Healthcare Design Awards from the American Institute of Architects Academy of Architecture for Health.

Office Buildings | Aug 1, 2023
Creating a nurturing environment: The value of a mother’s room in the workplace
Since becoming an architect, Rebecca Martin of Design Collaborative has drawn a mother’s room into numerous projects. But it wasn't until she became a mom that she fully appreciated their importance in the workspace.


