


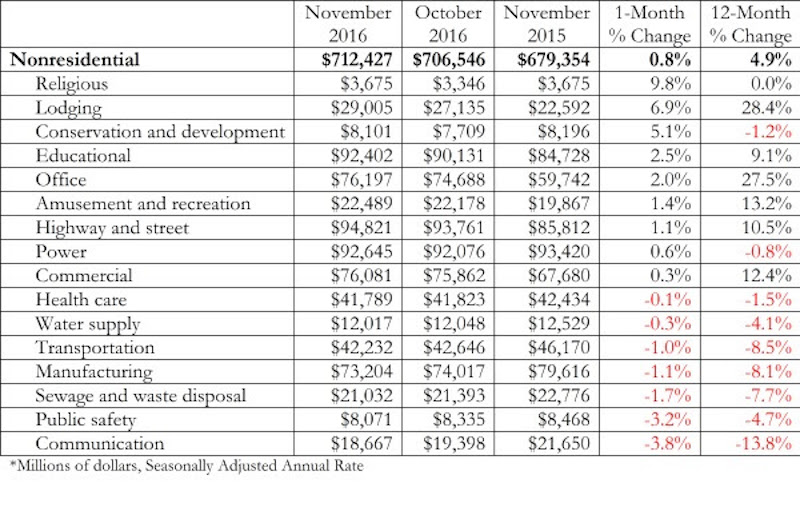
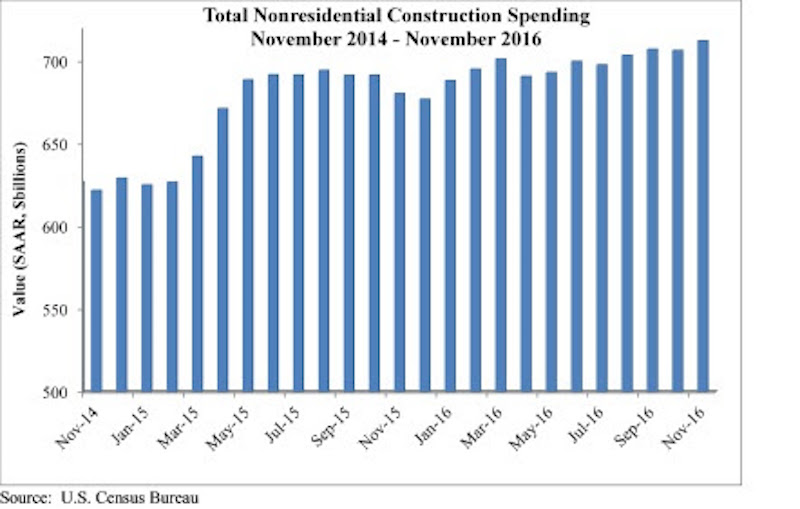
Nonresidential construction surged in November, according to analysis of U.S. Census Bureau data released by Associated Builders and Contractors (ABC). Nonresidential spending expanded to $712.4 billion on a seasonally adjusted, annualized rate in November, representing the highest level of spending in eight years.
October’s figure was upwardly revised by 1 percent (from $699.7 billion to $706.5 billion), while September’s figure was upwardly revised by 0.8 percent (from $701.7 billion to $707.2 billion). A bit more than half of the 16 subsectors experienced spending increases in November.
“Nonresidential construction spending is up approximately 5 percent on a year-over-year basis, and momentum should build further,” says ABC Chief Economist Anirban Basu in a press release. ““If the last few weeks are any indication, the 2017 economy will be associated with tax cuts, more government spending, less financial regulation, faster economic growth, a stronger U.S. dollar, robust stock market performance and greater overall CEO confidence. That should translate into improved construction spending moving forward.”
A stronger U.S. dollar, larger budget deficits, and rising interest rates could shrink U.S. exports and serve to suppress U.S. economic dynamism, but the current nonresidential construction outlook is promising, according to Basu.
Related Stories

Market Data | Jul 17, 2019
Design services demand stalled in June
Project inquiry gains hit a 10-year low.

Market Data | Jul 16, 2019
ABC’s Construction Backlog Indicator increases modestly in May
The Construction Backlog Indicator expanded to 8.9 months in May 2019.

K-12 Schools | Jul 15, 2019
Summer assignments: 2019 K-12 school construction costs
Using RSMeans data from Gordian, here are the most recent costs per square foot for K-12 school buildings in 10 cities across the U.S.

Market Data | Jul 12, 2019
Construction input prices plummet in June
This is the first time in nearly three years that input prices have fallen on a year-over-year basis.

Market Data | Jul 1, 2019
Nonresidential construction spending slips modestly in May
Among the 16 nonresidential construction spending categories tracked by the Census Bureau, five experienced increases in monthly spending.

Market Data | Jul 1, 2019
Almost 60% of the U.S. construction project pipeline value is concentrated in 10 major states
With a total of 1,302 projects worth $524.6 billion, California has both the largest number and value of projects in the U.S. construction project pipeline.

Market Data | Jun 21, 2019
Architecture billings remain flat
AIA’s Architecture Billings Index (ABI) score for May showed a small increase in design services at 50.2.

Market Data | Jun 19, 2019
Number of U.S. architects continues to rise
New data from NCARB reveals that the number of architects continues to increase.

Market Data | Jun 12, 2019
Construction input prices see slight increase in May
Among the 11 subcategories, six saw prices fall last month, with the largest decreases in natural gas.

Market Data | Jun 3, 2019
Nonresidential construction spending up 6.4% year over year in April
Among the 16 sectors tracked by the U.S. Census Bureau, nine experienced an increase in monthly spending, led by water supply and highway and street.


