


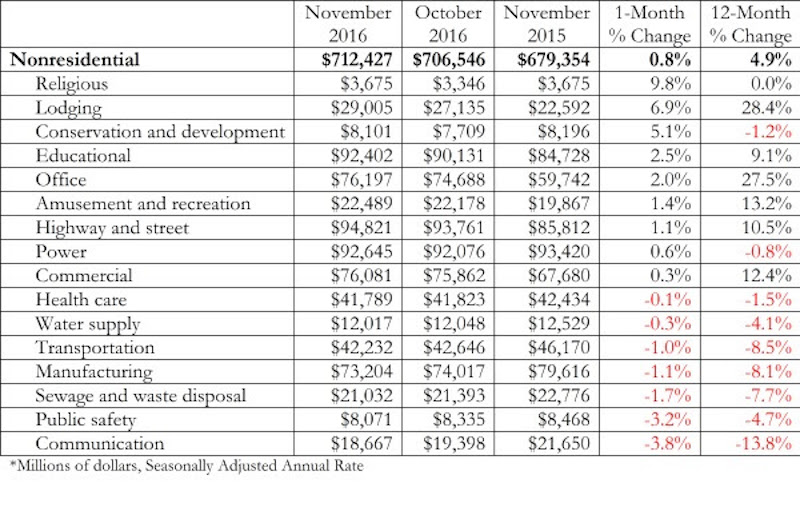
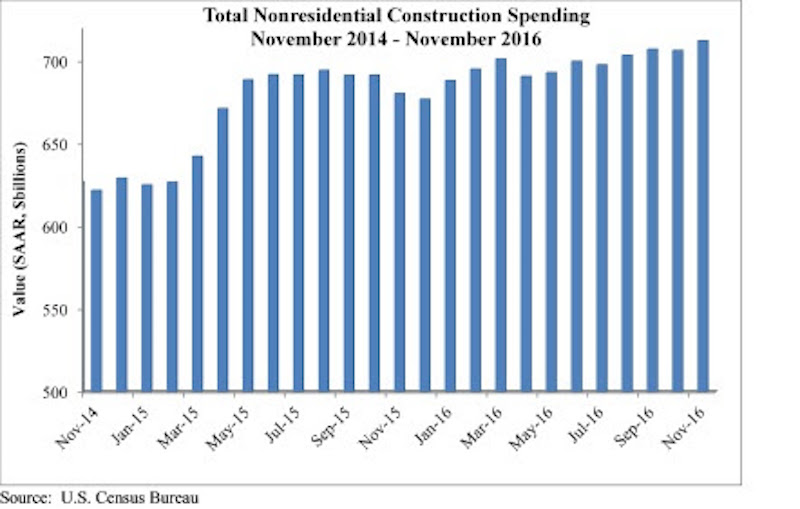
Nonresidential construction surged in November, according to analysis of U.S. Census Bureau data released by Associated Builders and Contractors (ABC). Nonresidential spending expanded to $712.4 billion on a seasonally adjusted, annualized rate in November, representing the highest level of spending in eight years.
October’s figure was upwardly revised by 1 percent (from $699.7 billion to $706.5 billion), while September’s figure was upwardly revised by 0.8 percent (from $701.7 billion to $707.2 billion). A bit more than half of the 16 subsectors experienced spending increases in November.
“Nonresidential construction spending is up approximately 5 percent on a year-over-year basis, and momentum should build further,” says ABC Chief Economist Anirban Basu in a press release. ““If the last few weeks are any indication, the 2017 economy will be associated with tax cuts, more government spending, less financial regulation, faster economic growth, a stronger U.S. dollar, robust stock market performance and greater overall CEO confidence. That should translate into improved construction spending moving forward.”
A stronger U.S. dollar, larger budget deficits, and rising interest rates could shrink U.S. exports and serve to suppress U.S. economic dynamism, but the current nonresidential construction outlook is promising, according to Basu.
Related Stories

Market Data | Oct 27, 2021
Only 14 states and D.C. added construction jobs since the pandemic began
Supply problems, lack of infrastructure bill undermine recovery.

Market Data | Oct 26, 2021
U.S. construction pipeline experiences highs and lows in the third quarter
Renovation and conversion pipeline activity remains steady at the end of Q3 ‘21, with conversion projects hitting a cyclical peak, and ending the quarter at 752 projects/79,024 rooms.

Market Data | Oct 19, 2021
Demand for design services continues to increase
The Architecture Billings Index (ABI) score for September was 56.6.

Market Data | Oct 14, 2021
Climate-related risk could be a major headwind for real estate investment
A new trends report from PwC and ULI picks Nashville as the top metro for CRE prospects.

Market Data | Oct 14, 2021
Prices for construction materials continue to outstrip bid prices over 12 months
Construction officials renew push for immediate removal of tariffs on key construction materials.

Market Data | Oct 11, 2021
No decline in construction costs in sight
Construction cost gains are occurring at a time when nonresidential construction spending was down by 9.5 percent for the 12 months through July 2021.

Market Data | Oct 11, 2021
Nonresidential construction sector posts first job gain since March
Has yet to hit pre-pandemic levels amid supply chain disruptions and delays.

Market Data | Oct 4, 2021
Construction spending stalls between July and August
A decrease in nonresidential projects negates ongoing growth in residential work.

Market Data | Oct 1, 2021
Nonresidential construction spending dips in August
Spending declined on a monthly basis in 10 of the 16 nonresidential subcategories.

Market Data | Sep 29, 2021
One-third of metro areas lost construction jobs between August 2020 and 2021
Lawrence-Methuen Town-Salem, Mass. and San Diego-Carlsbad, Calif. top lists of metros with year-over-year employment increases.


