


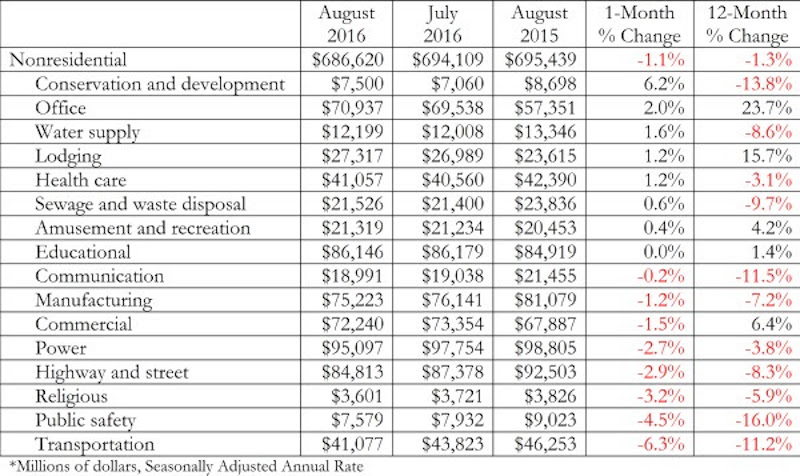
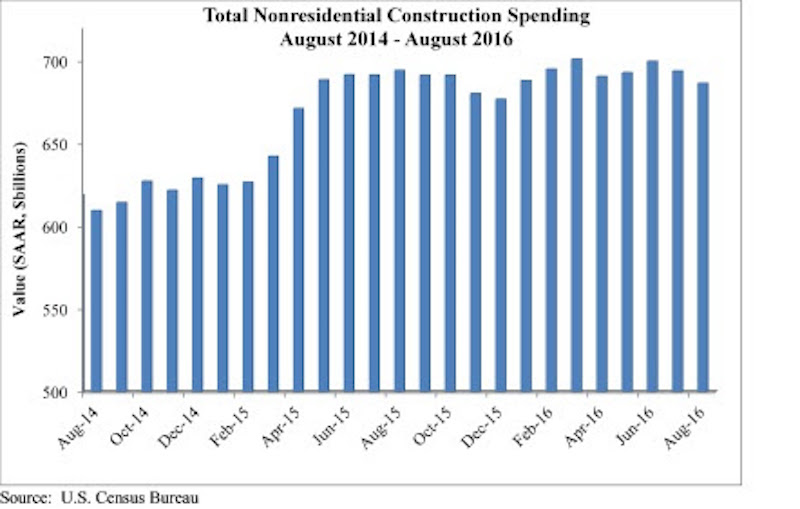
Nonresidential construction spending fell for a second consecutive month in August, according to analysis of U.S. Census Bureau released today by Associated Builders and Contractors (ABC). Nonresidential spending totaled $686.6 billion on a seasonally adjusted, annualized basis for the month, 1.1% lower than July’s total of $694.1 billion (revised down from $701 billion) and 1.3% below August 2015’s figure.
Private nonresidential construction spending fell just 0.4% for the month, while its public sector counterpart shrank 2%. Four of the five largest nonresidential subsectors—power, highway and street, commercial and manufacturing—combined to fall 2.2% on a monthly basis.
“While previous weak spending reports can almost completely be explained by diminished public construction spending, today’s report also revealed emerging weakness in private spending,” says ABC Chief Economist Anirban Basu.
However, spending has increased in some areas. Office-related construction increased 2% for the month and 24 percent on a year-over-year basis. Meanwhile, lodging-related construction spending increased 1.2% for the month and almost 16% year-over-year.
Other areas have underperformed. “Given the passage of a federal highway bill last year, one might have expected spending growth in the highway/street and transportation categories,” Basu says. “Those expectations have been unmet thus far. Transportation-related construction spending dipped by more than 6 percent in August and by more than 11 percent on a year-over-year basis. Highway and street spending is down by more than 8 percent on a year-ago basis, and was down nearly 3 percent for the month.”
Related Stories

Market Data | Aug 29, 2017
Hidden opportunities emerge from construction industry challenges
JLL’s latest construction report shows stability ahead with tech and innovation leading the way.

Market Data | Aug 28, 2017
U.S. hotel construction pipeline is up 7% year-over-year
For the economy, the rate of growth may be low but it’s running on all cylinders.

Market Data | Aug 23, 2017
Architecture Billings Index growth moderates
“The July figures show the continuation of healthy trends in the construction sector of our economy,” said AIA Chief Economist, Kermit Baker.

Architects | Aug 21, 2017
AIA: Architectural salaries exceed gains in the broader economy
AIA’s latest compensation report finds average compensation for staff positions up 2.8% from early 2015.

Market Data | Aug 20, 2017
Some suburban office markets are holding their own against corporate exodus to cities
An analysis of mortgage-backed loans suggests that demand remains relatively steady.
Market Data | Aug 17, 2017
Marcum Commercial Construction Index reports second quarter spending increase in commercial and office construction
Spending in all 12 of the remaining nonresidential construction subsectors retreated on both an annualized and monthly basis.

Industry Research | Aug 11, 2017
NCARB releases latest data on architectural education, licensure, and diversity
On average, becoming an architect takes 12.5 years—from the time a student enrolls in school to the moment they receive a license.

Market Data | Aug 4, 2017
U.S. grand total construction starts growth projection revised slightly downward
ConstructConnect’s quarterly report shows courthouses and sports stadiums to end 2017 with a flourish.

Market Data | Aug 2, 2017
Nonresidential Construction Spending falls in June, driven by public sector
June’s weak construction spending report can be largely attributed to the public sector.

Market Data | Jul 31, 2017
U.S. economic growth accelerates in second quarter; Nonresidential fixed investment maintains momentum
Nonresidential fixed investment, a category of GDP embodying nonresidential construction activity, expanded at a 5.2% seasonally adjusted annual rate.


