


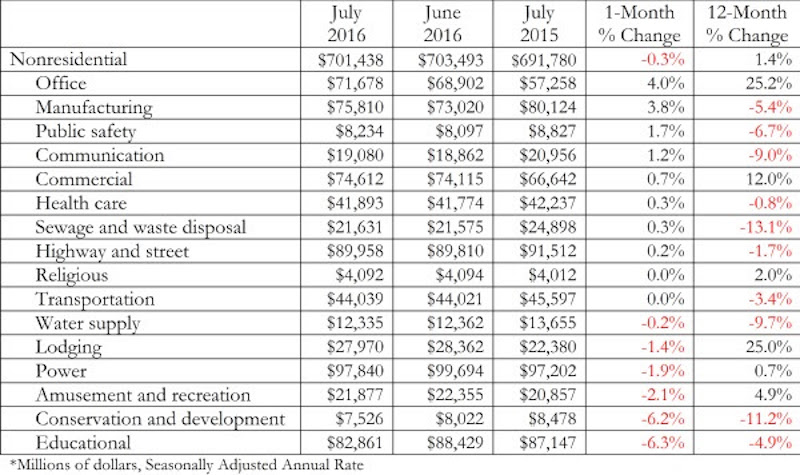
Nonresidential construction spending inched 0.3 percent lower in July largely due to a significant upward revision to June’s spending figure, according to analysis of U.S. Census Bureau data released today by Associated Builders and Contractors (ABC). Nonresidential spending totaled $701.4 billion on a seasonally adjusted annualized basis in July, the second highest month since November of 2008, right behind June, which was revised upward from $682 billion to $703.5 billion. Public nonresidential spending continued to falter, declining 3.2 percent for the month and 6.5 percent for the year.
Nonresidential construction spending has been suppressed over the last year or so with the primary factor being the lack of momentum in public spending. “This lack of public investment continues despite obvious deficiencies in water, road and other forms of infrastructure. The fact that all but two of the 12 public nonresidential public subsectors declined in July shows that the malaise is widespread,” says ABC Chief Economist Anirban Basu in a press release.
The second biggest factor deals with tightening commercial real estate standards that may have been brought on by growing regulatory pressures. “There is growing concern that key commercial real estate segments are in the process of being overbuilt, particularly in America’s largest cities, which are most likely to attract significant levels of foreign investment,” Basu says.
All is not negative, however, as the housing sector has begun to improve at a meaningful rate and the country continues to add a substantial number of jobs. Additionally, interest rates remain low.
Related Stories

Market Data | May 17, 2018
These 25 cities have the highest urban infill development potential
The results stem from a COMMERCIALCafé study.

Market Data | May 10, 2018
Construction costs surge in April as new tariffs and other trade measures lead to significant increases in materials prices
Association officials warn that the new tariffs and resulting price spikes have the potential to undermine benefits of tax and regulatory reform, urge administration to reconsider.

Market Data | May 7, 2018
Construction employers add 17,000 jobs in April and 257,000 for the year
Unemployment rate for construction increases slightly compared to year earlier as higher pay levels appears to be attracting people with recent construction experience back into the workforce.

Market Data | May 2, 2018
Construction employment increases in 245 metro areas between March 2017 & 2018, as trade fights & infrastructure funding shortfalls loom
Houston-The Woodlands-Sugar Land, Texas and Weirton-Steubenville, W.Va.-Ohio experience largest year-over-year gains; Baton Rouge, La. and Auburn-Opelika, Ala. have biggest annual declines.

Market Data | May 2, 2018
Nonresidential Construction down in March, private sector falters, public sector unchanged
February’s spending estimate was revised roughly $10 billion higher.

Market Data | Apr 30, 2018
Outlook mixed for renewable energy installations in Middle East and Africa region
Several major MEA countries are actively supporting the growth of renewable energy.

Market Data | Apr 12, 2018
Construction costs climb in March as wide range of input costs jump
Association officials urge Trump administration, congress to fund infrastructure adequately as better way to stimulate demand than tariffs that impose steep costs on contractors and project owners.

Market Data | Apr 9, 2018
Construction employers add 228,000 jobs over the year despite dip in March
Average hourly earnings increase to $29.43 in construction, topping private sector by nearly 10%; Association officials urge updating and better funding programs to train workers for construction jobs.

Market Data | Apr 4, 2018
Construction employment increases in 257 metro areas between February 2017 & 2018 as construction firms continue to expand amid strong demand
Riverside-San Bernardino-Ontario, Calif. and Merced, Calif. experience largest year-over-year gains; Baton Rouge, La. and Auburn-Opelika, Ala. have biggest annual declines in construction employment.

Market Data | Apr 2, 2018
Construction spending in February inches up from January
Association officials urge federal, state and local officials to work quickly to put recently enacted funding increases to work to improve aging and over-burdened infrastructure, offset public-sector spending drops.


