


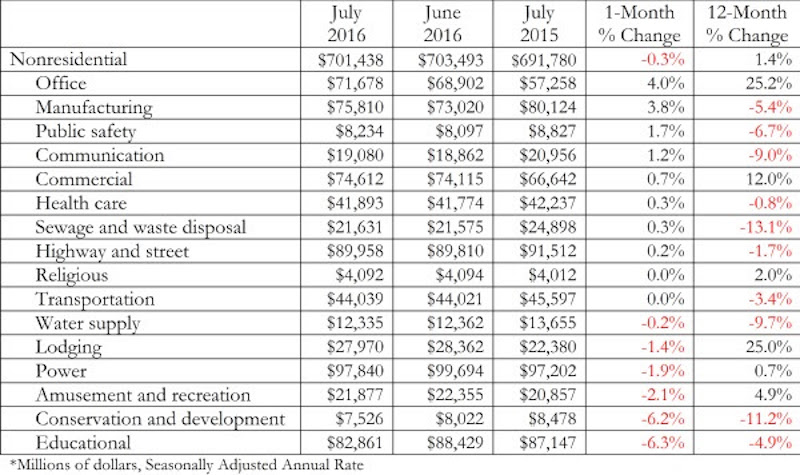
Nonresidential construction spending inched 0.3 percent lower in July largely due to a significant upward revision to June’s spending figure, according to analysis of U.S. Census Bureau data released today by Associated Builders and Contractors (ABC). Nonresidential spending totaled $701.4 billion on a seasonally adjusted annualized basis in July, the second highest month since November of 2008, right behind June, which was revised upward from $682 billion to $703.5 billion. Public nonresidential spending continued to falter, declining 3.2 percent for the month and 6.5 percent for the year.
Nonresidential construction spending has been suppressed over the last year or so with the primary factor being the lack of momentum in public spending. “This lack of public investment continues despite obvious deficiencies in water, road and other forms of infrastructure. The fact that all but two of the 12 public nonresidential public subsectors declined in July shows that the malaise is widespread,” says ABC Chief Economist Anirban Basu in a press release.
The second biggest factor deals with tightening commercial real estate standards that may have been brought on by growing regulatory pressures. “There is growing concern that key commercial real estate segments are in the process of being overbuilt, particularly in America’s largest cities, which are most likely to attract significant levels of foreign investment,” Basu says.
All is not negative, however, as the housing sector has begun to improve at a meaningful rate and the country continues to add a substantial number of jobs. Additionally, interest rates remain low.
Related Stories

Market Data | Jul 16, 2019
ABC’s Construction Backlog Indicator increases modestly in May
The Construction Backlog Indicator expanded to 8.9 months in May 2019.

K-12 Schools | Jul 15, 2019
Summer assignments: 2019 K-12 school construction costs
Using RSMeans data from Gordian, here are the most recent costs per square foot for K-12 school buildings in 10 cities across the U.S.

Market Data | Jul 12, 2019
Construction input prices plummet in June
This is the first time in nearly three years that input prices have fallen on a year-over-year basis.

Market Data | Jul 1, 2019
Nonresidential construction spending slips modestly in May
Among the 16 nonresidential construction spending categories tracked by the Census Bureau, five experienced increases in monthly spending.

Market Data | Jul 1, 2019
Almost 60% of the U.S. construction project pipeline value is concentrated in 10 major states
With a total of 1,302 projects worth $524.6 billion, California has both the largest number and value of projects in the U.S. construction project pipeline.

Market Data | Jun 21, 2019
Architecture billings remain flat
AIA’s Architecture Billings Index (ABI) score for May showed a small increase in design services at 50.2.

Market Data | Jun 19, 2019
Number of U.S. architects continues to rise
New data from NCARB reveals that the number of architects continues to increase.

Market Data | Jun 12, 2019
Construction input prices see slight increase in May
Among the 11 subcategories, six saw prices fall last month, with the largest decreases in natural gas.

Market Data | Jun 3, 2019
Nonresidential construction spending up 6.4% year over year in April
Among the 16 sectors tracked by the U.S. Census Bureau, nine experienced an increase in monthly spending, led by water supply and highway and street.

Market Data | Jun 3, 2019
4.1% annual growth in office asking rents above five-year compound annual growth rate
Market has experienced no change in office vacancy rates in three quarters.


