


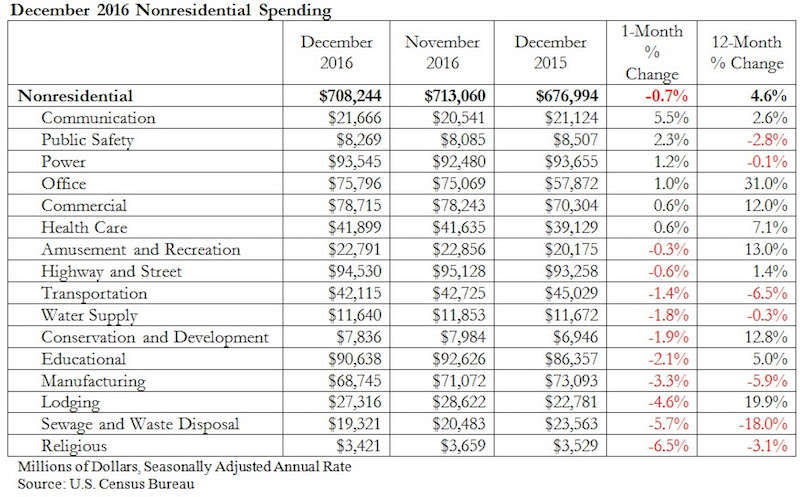
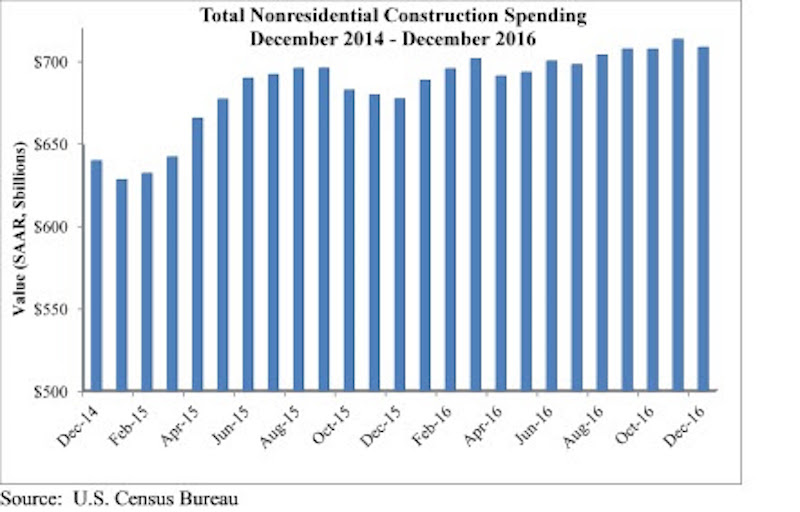
Nonresidential construction spending slipped 0.7 percent in the final month of 2016, but increased 4.6 percent over the previous year, according to analysis of U.S. Census Bureau data recently released by Associated Builders and Contractors (ABC). Nonresidential spending decreased from $713.1 billion in November to $708.2 billion in December on a seasonally adjusted, annualized basis.
Both November’s estimate ($713.1 billion) and October’s estimate ($707.1 billion) were upwardly revised by less than one-tenth of a percent. Private nonresidential spending remained flat for the month, while public nonresidential spending contracted 1.7 percent.
“Private spending growth, which has led nonresidential spending growth for months, remained flat in December and, as a result, the preexisting story of the industry remains fundamentally unchanged,” said ABC Chief Economist Anirban Basu in a release. “Public construction spending has been soft for many years and the December spending data merely served to extend that part of the tale. Spending in the sewage and waste disposal, transportation, and public safety sectors was particularly weak during the past 12 months. Private spending growth has been on-again, off-again for much of the year, so it is not a surprise that last month’s robust spending report was followed by a flat one.
“On the bright side, the architectural community became much busier in December, signaling an acceleration of commercial activity to come,” said Basu. “In addition, the new administration appears committed to fulfilling its campaign promises, including a pledge to step up infrastructure spending. This has asphalt, pavement and other infrastructure-intensive contractors expressing more confidence in their economic future than they have for many years. As such, the December data provide little insight into the future trajectory of nonresidential construction spending, which is set to improve markedly during the next six to 12 months.”
Related Stories
 reported the November ABI score was 55.0, up from a score of 51.7 in the previous month. Photo: Pixabay")
Market Data | Dec 20, 2017
Architecture billings upturn shows broad strength
The American Institute of Architects (AIA) reported the November ABI score was 55.0, up from a score of 51.7 in the previous month.

Market Data | Dec 14, 2017
ABC chief economist predicts stable 2018 construction economy
There are risks to the 2018 outlook as a number of potential cost increases could come into play.

Market Data | Dec 13, 2017
Top world regions and markets in the global hotel construction pipeline
The top world region by project count is North America.

Market Data | Dec 11, 2017
Global hotel construction pipeline is growing
The Total Pipeline stands at 12,427 Projects/2,084,940 Rooms.

Market Data | Dec 11, 2017
Construction backlog surges, sets record in third quarter
CBI is a leading economic indicator that reflects the amount of construction work under contract, but not yet completed.

Market Data | Dec 7, 2017
Buoyed by healthy economy, ABC Index finds contractors upbeat
Despite rising construction labor and materials costs, 55% of contractors expect their profit margins to expand in the first half of 2018.

Market Data | Dec 5, 2017
Top health systems engaged in $21 billion of U.S. construction projects
Largest active projects are by Sutter Health, New York Presbyterian, and Scripps Health.

Industry Research | Nov 28, 2017
2018 outlook: Economists point to slowdown, AEC professionals say ‘no way’
Multifamily housing and senior living developments head the list of the hottest sectors heading into 2018, according a survey of 356 AEC professionals.

Market Data | Nov 27, 2017
Construction's contribution to U.S. economy highest in seven years
Thirty-seven states benefited from the rise in construction activity in their state, while 13 states experienced a reduction in activity.

Market Data | Nov 15, 2017
Architecture Billings bounce back
Business conditions remain uneven across regions.


