


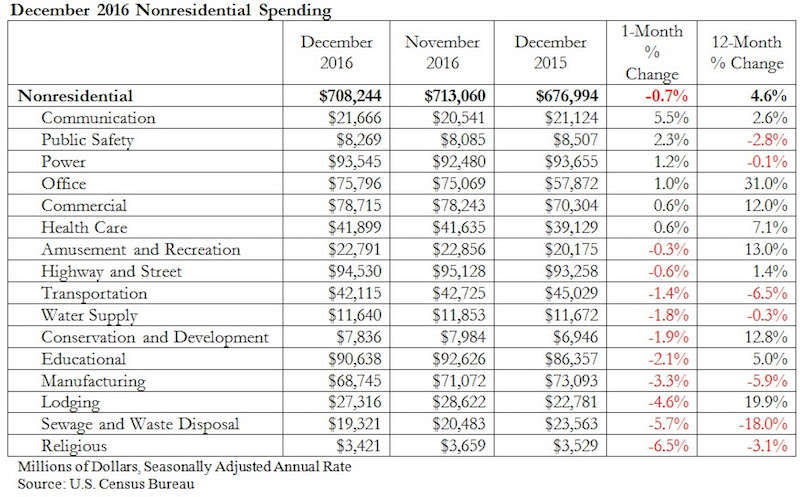
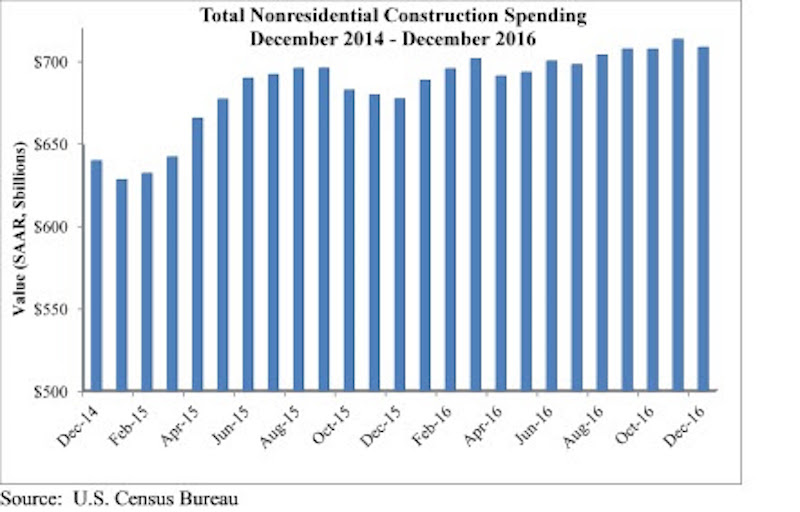
Nonresidential construction spending slipped 0.7 percent in the final month of 2016, but increased 4.6 percent over the previous year, according to analysis of U.S. Census Bureau data recently released by Associated Builders and Contractors (ABC). Nonresidential spending decreased from $713.1 billion in November to $708.2 billion in December on a seasonally adjusted, annualized basis.
Both November’s estimate ($713.1 billion) and October’s estimate ($707.1 billion) were upwardly revised by less than one-tenth of a percent. Private nonresidential spending remained flat for the month, while public nonresidential spending contracted 1.7 percent.
“Private spending growth, which has led nonresidential spending growth for months, remained flat in December and, as a result, the preexisting story of the industry remains fundamentally unchanged,” said ABC Chief Economist Anirban Basu in a release. “Public construction spending has been soft for many years and the December spending data merely served to extend that part of the tale. Spending in the sewage and waste disposal, transportation, and public safety sectors was particularly weak during the past 12 months. Private spending growth has been on-again, off-again for much of the year, so it is not a surprise that last month’s robust spending report was followed by a flat one.
“On the bright side, the architectural community became much busier in December, signaling an acceleration of commercial activity to come,” said Basu. “In addition, the new administration appears committed to fulfilling its campaign promises, including a pledge to step up infrastructure spending. This has asphalt, pavement and other infrastructure-intensive contractors expressing more confidence in their economic future than they have for many years. As such, the December data provide little insight into the future trajectory of nonresidential construction spending, which is set to improve markedly during the next six to 12 months.”
Related Stories

Market Data | Jul 17, 2019
Design services demand stalled in June
Project inquiry gains hit a 10-year low.

Market Data | Jul 16, 2019
ABC’s Construction Backlog Indicator increases modestly in May
The Construction Backlog Indicator expanded to 8.9 months in May 2019.

K-12 Schools | Jul 15, 2019
Summer assignments: 2019 K-12 school construction costs
Using RSMeans data from Gordian, here are the most recent costs per square foot for K-12 school buildings in 10 cities across the U.S.

Market Data | Jul 12, 2019
Construction input prices plummet in June
This is the first time in nearly three years that input prices have fallen on a year-over-year basis.

Market Data | Jul 1, 2019
Nonresidential construction spending slips modestly in May
Among the 16 nonresidential construction spending categories tracked by the Census Bureau, five experienced increases in monthly spending.

Market Data | Jul 1, 2019
Almost 60% of the U.S. construction project pipeline value is concentrated in 10 major states
With a total of 1,302 projects worth $524.6 billion, California has both the largest number and value of projects in the U.S. construction project pipeline.

Market Data | Jun 21, 2019
Architecture billings remain flat
AIA’s Architecture Billings Index (ABI) score for May showed a small increase in design services at 50.2.

Market Data | Jun 19, 2019
Number of U.S. architects continues to rise
New data from NCARB reveals that the number of architects continues to increase.

Market Data | Jun 12, 2019
Construction input prices see slight increase in May
Among the 11 subcategories, six saw prices fall last month, with the largest decreases in natural gas.

Market Data | Jun 3, 2019
Nonresidential construction spending up 6.4% year over year in April
Among the 16 sectors tracked by the U.S. Census Bureau, nine experienced an increase in monthly spending, led by water supply and highway and street.


